Q2 2026 Market Outlook – Quarterly Investment Review

Q2 2026 Market Outlook – Quarterly Investment Review
The US is pouring more capital into AI data centers in 6 years (~$930B) than the inflation-adjusted cost of the Marshall Plan, Apollo, Manhattan Project, and the Interstate Highway System — combined. Meanwhile: AI ≈ 45% of the S&P. Energy ≈ 4%. Everyone is overweight the thing that needs power. Underweight the power. – Ron Stoeferle, May 12th 2026
Markets Look Through the Hormuz Crisis
Despite the troubling backdrop in the Middle East, equity markets enjoyed a strong quarter. This was partly because at the end of March markets were near the bottom of their plunge following the closure of the Hormuz Strait, but also due to exceptionally strong earnings driven by capital expenditure in AI-related projects and governments continuing to provide substantial fiscal support. Nonetheless, with the situation in Hormuz still unresolved at the end of June, it was astonishing how powerful the move was, as the S&P 500 surged to new highs. The rally was led by the semiconductor index, which doubled, although it also masked a furious rotation out of software stocks such as Microsoft and Adobe, which continued to decline. This move was reflected in Emerging Markets, where a handful of stocks in Korea and Taiwan leapt higher.
For the quarter, the MSCI World rose 13.3%, the MSCI Emerging Markets Index gained 22.6%, US 10-year Treasuries were flat, and gold fell 14.2%.
The Hormuz crisis remains unsettled. So far, the world has been shielded from a major inflationary shock by drawing down reserves; estimates suggest that 1.4 billion barrels of oil and oil products have been released globally from reserves since the conflict began. However, this cushion is not limitless. While the United States and Iran have signed a Memorandum of Understanding aimed at ending the conflict, agreeing on the details is proving difficult. Despite an overwhelming military victory, the US has failed to establish control of the vital sea lanes through which oil, gas and many of their derivatives flow.
Global Supply Chains and the Return of Inflation Risk
The conflict has highlighted how many critical products originate in the region, including sulphuric acid, which is essential for mining; helium, which is vital for semiconductor manufacturing; fertiliser; and jet fuel. The situation underscores a wider point: there are numerous global choke points. After thirty years of globalisation, production has become concentrated in a handful of locations, while the risk of disruption has increased.
The Malacca Strait, for example, is under three kilometres wide at its narrowest point. China maintains an almost complete monopoly in the production of rare earths, while Asia dominates large parts of the world’s manufacturing base. The global supply system is a sophisticated ballet built on the assumption that there will be no impediments. The de-industrialisation of the West has therefore left it vulnerable to choke points on the other side of the world.
Restarting these industries at home is proving difficult. The result is a world that is more prone to inflation, both because countries are likely to stockpile commodities to guard against future disruptions and because efforts to relocate strategic industries will be highly resource intensive. In many areas, countries will effectively be starting from scratch. In international shipping, for instance, the largest American shipping company, Matson, accounts for just 0.2% of the global market.
The AI Investment Boom Continues
In the United States, the stock market is being driven almost exclusively by the AI boom. Indeed, this boom is responsible for much of the growth in the economy. The numbers are extraordinary. The hyperscalers are forecast to spend $805 billion on their AI plans this year and $1.116 trillion next year. Remarkably, these spending plans continue to increase.
McKinsey estimates that $6.7 trillion will need to be spent on data centres between now and 2030. The scale of investment has reached the point where many of these companies are spending all of their cash flow, and more, to remain competitive. It is a curious situation in which the most profitable companies in history are reinvesting virtually every dollar they earn simply to stay in the race.
This spending is boosting corporate earnings in three ways. It is driving capital expenditure, supporting stock market gains and therefore consumer spending through wealth effects, and improving productivity. Since the launch of ChatGPT, US labour productivity has increased in 13 of the past 14 quarters.
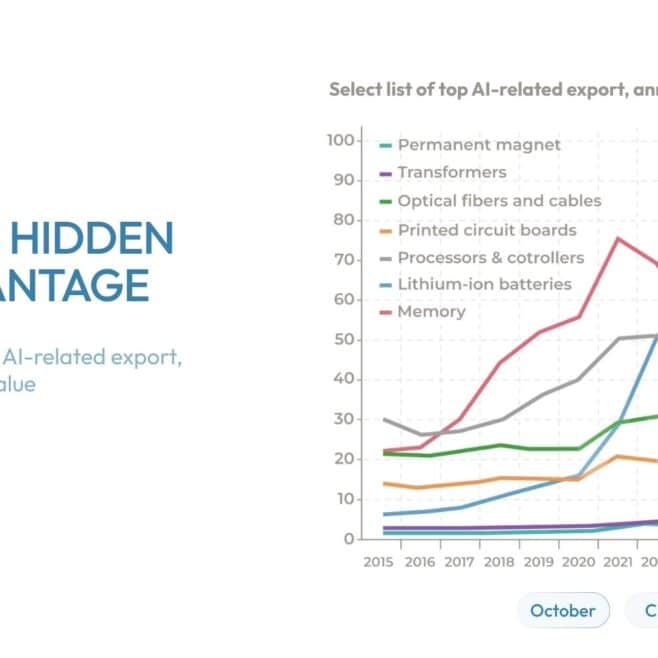
While select AI-related stocks have soared, many of the commodities essential to building the required infrastructure and data centres have been largely overlooked. Having lagged the broader AI trade, they are beginning to look increasingly attractive.
Mega-Cap Fundraising and Growing Liquidity Concerns
The last quarter was notable for the launch and announcement of several enormous stock market listings. Elon Musk’s SpaceX listed at a valuation of $1.77 trillion, raising $86 billion of fresh capital, followed a few weeks later by a further $20 billion in the debt markets. Together with his Tesla holdings, Musk became the world’s first trillionaire, with a net worth exceeding the value of bitcoin.
Anthropic and OpenAI are also targeting market listings at valuations above $1 trillion. In addition, Alphabet raised $80 billion in equity capital and Meta is expected to raise substantial funds as well. In total, these companies may raise close to $300 billion. While sizeable, this remains manageable in the context of a stock market that returned $1.6 trillion to shareholders last year.
However, from mid-August through year-end, approximately half of SpaceX’s market capitalisation — roughly $1 trillion of stock — becomes unlocked and eligible for sale. The scale of this potential supply is considerably more challenging to absorb. Given the pipeline of upcoming IPOs and secondary offerings, the second half of 2026 could experience significantly greater liquidity stress than investors have become accustomed to during recent years of abundant liquidity.
Moreover, the returns on AI investment remain largely unproven. Revenues are modest and profits even more so. Yet AI has become such a dominant market narrative that it has drained attention and capital from many other sectors, leaving broad swathes of the market languishing.
This presents a particular challenge for private equity, which has struggled to realise investments despite strong public markets because many assets are still held at valuations that buyers are unwilling to accept. Private equity and private credit flourished after the 2008 financial crisis largely because they operated with lighter regulation than public markets and banks. However, signs of strain are beginning to emerge.
Many institutions have substantial allocations to private assets. To the extent they require liquidity and cannot access it through those investments, they may need to sell listed equities and bonds instead, creating additional pressure on public markets.
Bond Markets Face Structural Headwinds
OECD bond markets have been disappointing investments for several years. One reason is that governments across the developed world have issued excessive amounts of debt for more than two decades as they attempted to spend their way towards economic growth. The debt burden has now become so large that interest payments are consuming ever-growing portions of national budgets.
In the United States, federal interest expense represented 8.7% of federal receipts in fiscal 2021. During the first five months of fiscal 2026, that figure exceeded 20%. In May, the US Treasury sold 30-year bonds at a yield above 5%, the highest level since 2007 and a sign that enthusiasm for the world’s most important bond market is fading.
Nor does the United States have the most concerning outlook. The UK picture is particularly alarming. Government spending consistently exceeds projections, while debt raised during the era of ultra-low interest rates now needs to be refinanced at materially higher yields.
The extent of the adjustment can be seen in a UK government bond issued in May 2020 and maturing in 2062, whose price fell from 100 to as low as 22 in May this year. UK government bond yields are now higher than those of Greece and Morocco.
The outlook for bonds remains challenging. Inflationary pressures from the Iran conflict are still filtering through the global economy, while even technology companies are raising prices, with Apple increasing some prices by as much as 20%. This comes at a time when many governments are already grappling with fiscal deficits and rising pressure to increase military expenditure.
Why Japan Could Matter More Than Investors Expect
Perhaps the most significant bond market development has occurred in Japan. The near-zero interest rates that prevailed for almost three decades have started to move higher and closer to those available in Western markets.
Japan’s enormous pool of domestic savings has long supported global asset markets because opportunities at home were limited. As Japanese yields become more attractive, capital has a growing incentive to return home. Should that process accelerate, it could have meaningful implications for speculative assets and liquidity conditions globally.
Investment Outlook: Diversification Over Concentration
At present, stock markets remain dominated by the AI theme and the extraordinary earnings growth being generated by the companies leading this technological revolution. AI is undoubtedly transformative. However, transformative industries can become poor investments when enthusiasm reaches extremes, because everyone builds simultaneously and pricing power evaporates when demand eventually slows.
The bubble may therefore lie more in the “E” than the “P” of the P/E equation.
It is notable that Warren Buffett recently remarked that he was seeing more speculation than at any other point in his career — a remarkable statement from a ninety-five-year-old investor with such experience.
The safer opportunities may lie in trends that were temporarily interrupted by the Iran conflict. Last year saw a rotation away from highly valued US assets towards more attractively priced opportunities in Europe, Japan and Emerging Markets, although investors should be careful not to chase the hottest parts of the market.
A US market collapse is not inevitable. While US indices are trading at elevated levels, they may simply deflate over an extended period, as occurred between 1966 and 1982 when the market went essentially nowhere. Beneath the surface, however, there were still numerous opportunities and skilled stock pickers generated attractive returns.
As we conclude this Q2 2026 Market Outlook, investors should increasingly focus on diversifying portfolios across geographies and sectors. Bonds remain broadly unattractive, while in currencies the US dollar is likely to weaken moderately over time. Particular attention should be paid to the Japanese yen, which may become increasingly influential as global capital flows evolve.
Written by James Macpherson
Click HERE to download the full Q2 2026 market oulook.
Past performance is not indicative of future results. The views, strategies and financial instruments described in this document may not be suitable for all investors. Opinions expressed are current opinions as of date(s) appearing in this material only. References to market or composite indices, benchmarks or other measures of relative market performance over a specified period of time are provided for your information only. NS Partners provides no warranty and makes no representation of any kind whatsoever regarding the accuracy and completeness of any data, including financial market data, quotes, research notes or other financial instrument referred to in this document. This document does not constitute an offer or solicitation to any person in any jurisdiction in which such offer or solicitation is not authorized or to any person to whom it would be unlawful to make such offer or solicitation. Any reference in this document to specific securities and issuers are for illustrative purposes only, and should not be interpreted as recommendations to purchase or sell those securities. References in this document to investment funds that have not been registered with the FINMA cannot be distributed in or from Switzerland except to certain categories of eligible investors. Some of the entities of the NS Partners Group or its clients may hold a position in the financial instruments of any issuer discussed herein, or act as advisor to any such issuer. Additional information is available on request. © NS Partners Group
Article tagged by: