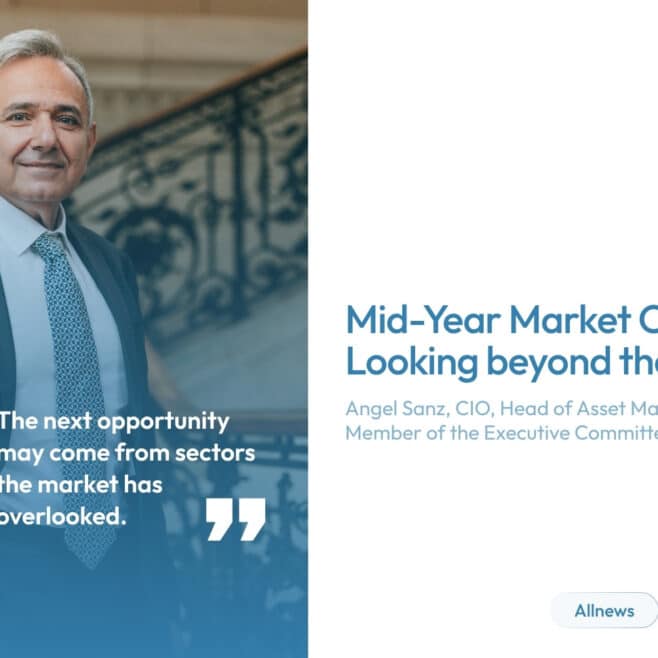
May 2026 market outlook: Crazy
May 2026 Market Outlook: Crazy!
“Crazy” – Gnarls Barkley, 2006
“I remember when, I remember when I lost my mind…” The iconic words of Gnarls Barkley perfectly capture the euphoric trading desks of May 2026.
A relentless surge in computing demand drove the global semiconductor sector into an absolute buying frenzy. Driven by next-generation artificial intelligence infrastructure, memory hardware stocks experienced an astonishing vertical rally. This hyper-growth ignited a dramatic market divergence, widening the performance gap between technology-heavy indices and more traditional benchmarks.
This market outlook highlights how AI-related infrastructure spending continues to reshape market leadership. While concerns about concentration and valuation persist, investor enthusiasm remains firmly anchored to the companies powering the next phase of the artificial intelligence revolution.
“Does that make me crazy? Possibly.” Skeptics warning of a speculative technology bubble were quickly silenced by blockbuster corporate earnings. South Korean heavyweight SK Hynix spearheaded the charge, soaring more than 61% thanks to its near-monopoly position in high-bandwidth memory chips. Concurrently, Micron Technology gained 79%, crossing the symbolic $1 trillion market capitalization threshold. Even hardware supplier Seagate Technology joined the rally, benefiting from sustained cloud infrastructure spending to deliver a 21% monthly gain.
The three companies — SK Hynix, Micron and Seagate — have seen their share prices increase tenfold in just 12 months.
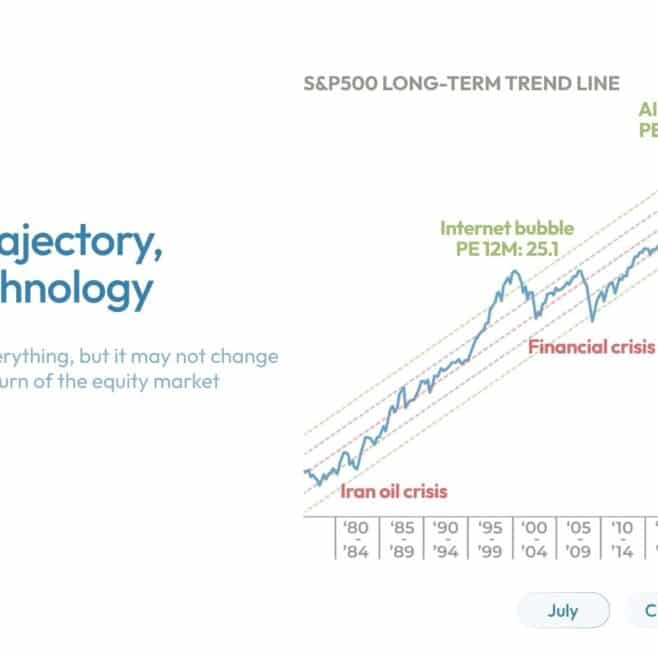
Needless to say, after a six-month pause, market concentration is back at elevated levels. Just 10 companies now represent more than 40% of the S&P 500, an all-time record. Eleven US-listed stocks now boast market capitalizations above $1 trillion — a threshold considered exceptional when Apple first crossed it in 2018.
Moreover, the United States is no longer alone in this exclusive club. Within Emerging Markets, TSMC, Samsung, SK Hynix and Saudi Aramco have also joined the trillion-dollar ranks.
“Crazy”, indeed.
The numbers behind this market outlook reinforce the narrative. The MSCI World gained 4.4% during the month, although performance dispersion remained significant. The technology-heavy Nasdaq rose 10.5%, compared with 5.2% for the S&P 500 and a more modest 2.4% for the Stoxx Europe 600. Japan delivered a strong 6.2% return, while the MSCI Emerging Markets Index, supported by its technology exposure, advanced 9.5%.
Growth clearly regained leadership, posting a 6.9% return, while Value lagged behind with a still respectable gain of 2%.
Fixed-income markets remained relatively calm, with only modest movements across both bonds and currencies. Oil prices experienced substantial volatility throughout the month, driven by alternating announcements regarding a potential ceasefire between Iran and the United States, but ultimately ended May down 16.7%.
Gold also retreated modestly (-1.5%), although it remains up 5% year-to-date.
Ultimately, this market outlook serves as a reminder that market leadership remains increasingly concentrated around the companies enabling the AI ecosystem. Whether this represents a new structural era or the early signs of excess remains one of the key questions facing investors.
This content is provided for information purposes only and does not constitute investment advice, an offer, solicitation or recommendation to buy or sell any financial instrument or investment product.
The views and opinions expressed are those of NS PARTNERS SA at the date of publication and may change without notice. References to specific securities, sectors or market developments are provided for illustrative purposes only and should not be interpreted as investment recommendations or investment research.
Past performance does not predict future returns. The value of investments and the income derived from them may fluctuate and investors may not recover the amount originally invested. Investments involve risks, including possible loss of capital.
References to market indices, benchmarks or other measures of relative market performance are provided for information purposes only. NS PARTNERS SA makes reasonable efforts to ensure the accuracy of the information contained herein but provides no warranty or representation as to its completeness or accuracy.
Some entities of the NS Partners Group or their clients may hold positions in the financial instruments mentioned or may act as advisor to related issuers.
This content may not be distributed or used in any jurisdiction where such distribution or use would be contrary to local laws or regulations. Additional information is available upon request.
© NS Partners Group
Article tagged by: