Market Volatility Surge: How to Avoid a Perfect Storm in March 2026
Market Volatility Surge: How to Avoid a Perfect Storm in March 2026
March 2026: A Violent Wake-Up Call for Markets
March 2026 is shaping up to be one of the most challenging months for financial markets in recent years. Once again, March delivers. Global equities, as measured by the MSCI World Index, fell by -8.5% over the month.
While the correction may not come as a complete surprise—markets had felt increasingly fragile in recent months—it highlights a key point: geopolitical risks had been significantly underestimated, even if they are inherently difficult to predict. More importantly, the period was marked by a sharp and simultaneous rise in market volatility across regions and asset classes.
A Broader Market Shock
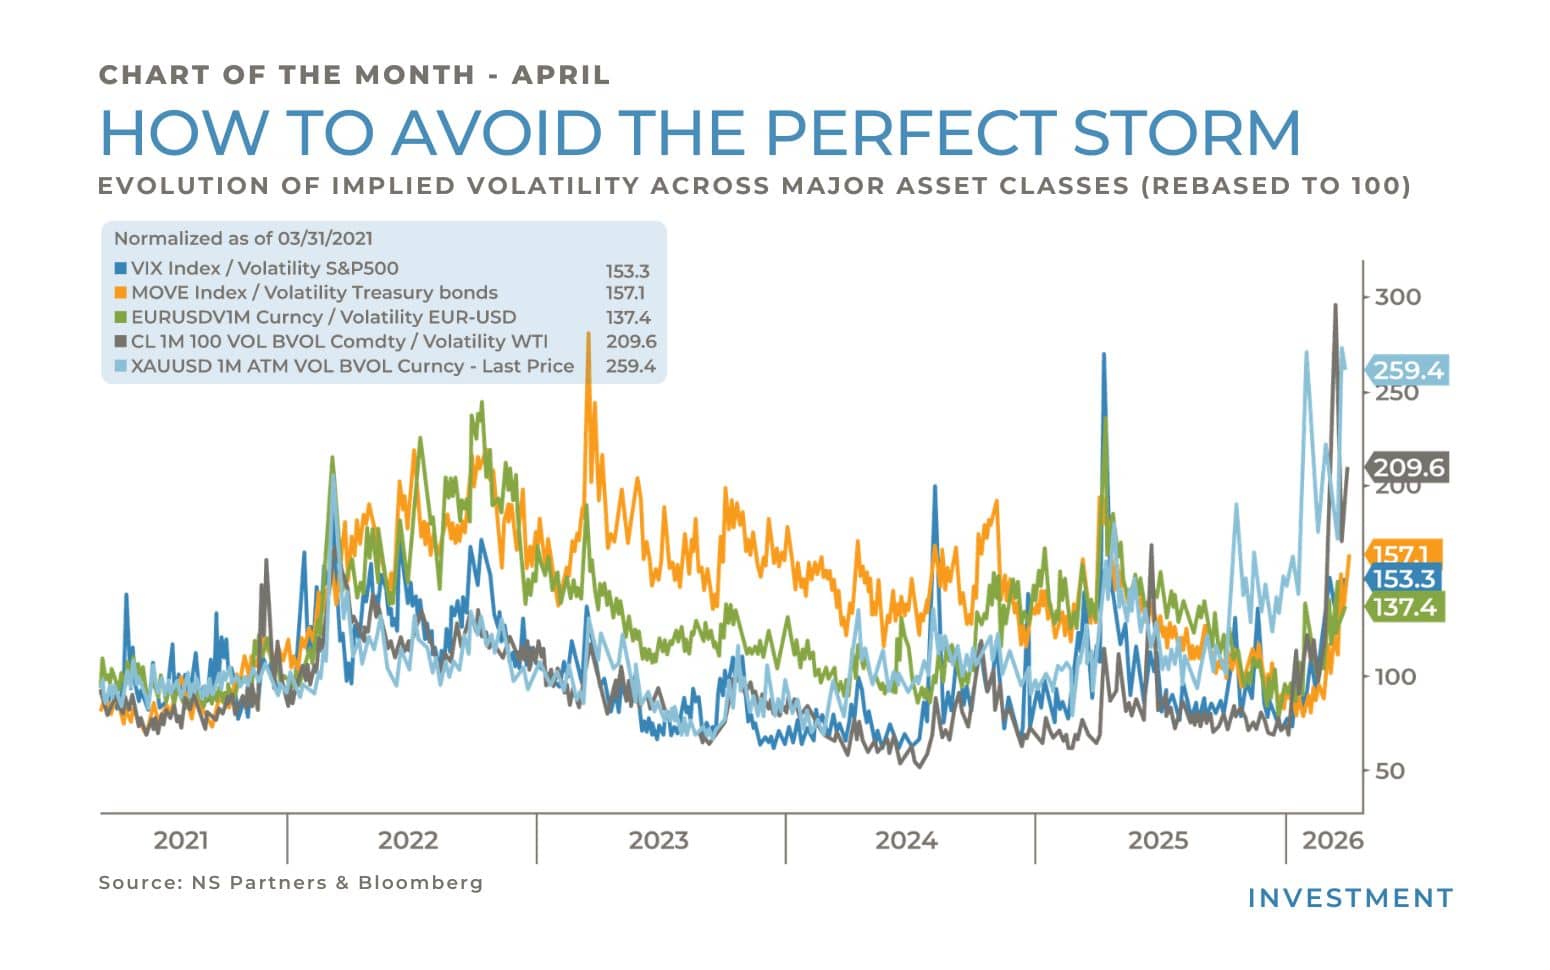
What truly defines this period is not just the equity drawdown, but the magnitude of moves across all asset classes. The chart highlights the evolution of implied volatility across major asset classes over the past five years, with all series rebased to 100 at the starting point.
In March 2026, volatility has surged simultaneously in:
-
US equities
-
US Treasuries
-
EUR/USD exchange rate
-
Commodities
-
Gold
Compared to five years ago (base 100), all these markets now exhibit significantly higher implied volatility levels, illustrating a rare synchronization of market volatility across traditionally uncorrelated segments.
What’s Different This Time?
The current spike in volatility recalls the 2022 shock triggered by the war in Ukraine and the ensuing inflation surge. However, this episode is more sudden and more pervasive, as markets were emerging from unusually low volatility levels—especially in rates, currencies and commodities. Geopolitical tensions, particularly those affecting energy markets and supply chains, have further intensified the move, amplifying cross-asset market volatility.
No Safe Haven
Traditionally, periods of equity market stress are partially offset by gains in defensive assets such as government bonds or gold. This time, however, these traditional hedges have failed to provide protection. Peak to trough, gold lost about 18% intramonth, while an investment in 10-year US Treasury bonds would have resulted in a loss of more than 4% over the same period.
In such environments, where diversification benefits break down, a low volatility investment strategy becomes particularly relevant, as it aims to limit drawdowns while maintaining more stable return profiles.
The Case for Diversified Hedge Funds
Yet, even in such challenging conditions, not all strategies are equally exposed. As in previous periods of market stress, diversified multi-strategy hedge funds have demonstrated their ability to navigate volatile environments.
This is precisely the approach implemented in our low volatility multi-strategy investment approach. Drawing on more than 25 years of experience, the strategy is designed to deliver steady, uncorrelated returns across market cycles.
While global equity markets are down approximately 4.0% year-to-date, the strategy remains in positive territory. Over the past five years, it has delivered an annualized return of around 5.8%, with low volatility of approximately 2.0% and no meaningful correlation to equity markets.
Some months may feel uneventful in terms of performance. But in periods like the one we’ve just experienced, capital preservation and stability become invaluable. Ultimately, managing market volatility is not only about performance, but about ensuring resilience across market regimes. Sometimes, the real luxury in investing is simple: being able to sleep at night.
Written by Cédric Dingens
Past performance is not indicative of future results. The views, strategies and financial instruments described in this document may not be suitable for all investors. Opinions expressed are current opinions as of date(s) appearing in this material only. References to market or composite indices, benchmarks or other measures of relative market performance over a specified period of time are provided for your information only.
NS Partners provides no warranty and makes no representation of any kind whatsoever regarding the accuracy and completeness of any data, including financial market data, quotes, research notes or other financial instrument referred to in this document. This document does not constitute an offer or solicitation to any person in any jurisdiction in which such offer or solicitation is not authorized or to any person to whom it would be unlawful to make such offer or solicitation.
Any reference in this document to specific securities and issuers are for illustrative purposes only, and should not be interpreted as recommendations to purchase or sell those securities. References in this document to investment funds that have not been registered with the FINMA cannot be distributed in or from Switzerland except to certain categories of eligible investors.
Some of the entities of the NS Partners Group or its clients may hold a position in the financial instruments of any issuer discussed herein, or act as advisor to any such issuer. Additional information is available on request.
© NS Partners Group
Article tagged by: