When Alpha Meets a Crowded Market

Long/Short Equity: Alpha Survives the Squeeze

This month’s chart highlights a key feature of fundamental equity long/short investing: while short-term results can be affected by positioning and factor rotations, long-term alpha is ultimately driven by stock selection.

Since 2022, long/short managers have generated approximately 25–30% cumulative alpha on their long books, despite several periods of market stress. Over the same period, the MSCI World Index gained more than 60%, demonstrating that strong stock-picking can continue to create value even in rising markets.

Short positions, meanwhile, are not intended to be a persistent source of returns. Rather, they serve as a risk-management tool, helping to reduce volatility and preserve capital during periods of market dislocation.
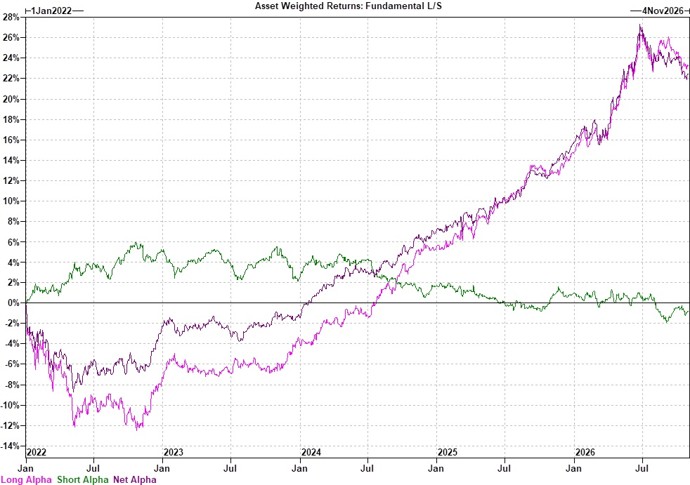
Cumulative long, short and net alpha for fundamental equity long/short strategies from January 2022 to November 2026

Over the past two years, investors heavily favoured themes linked to artificial intelligence, semiconductors and infrastructure spending, creating increasingly crowded positioning across the market.

As concerns emerged around the sustainability of AI-related spending, these crowded trades unwound sharply. What began as a sector correction quickly evolved into a broader factor reversal, affecting growth and momentum stocks as well as many businesses viewed as indirect beneficiaries of the AI investment cycle.

As a result, even well-diversified portfolios suffered as a wide range of holdings became exposed to the same underlying market theme.

October proved particularly challenging for hedge funds. The unwind of crowded AI and semiconductor exposures, combined with widespread de-risking, drove correlations sharply higher and reduced the benefits of diversification.

Technology stocks weakened, market leadership reversed and many defensive positions failed to provide protection.

Importantly, most managers entered the period with moderate market exposure. The weakness was therefore driven less by excessive beta and more by an abrupt factor rotation and highly correlated market moves.

History shows that crowding events and factor reversals can create temporary setbacks, but they rarely undermine the long-term value of disciplined stock selection.

Today, many companies held by leading long/short managers continue to deliver solid fundamentals despite significant share-price corrections. Valuations have become more attractive, while long-term earnings prospects remain largely intact.

The recent drawdown serves as a reminder that alpha generation is rarely linear. While positioning can temporarily overwhelm fundamentals, equity long/short investing remains one of the most effective approaches for capturing stock-specific alpha over a full market cycle.

Written by Cédric Dingens, Head of Alternative Investments

Download the full PDF version: When Alpha Meets a Crowded Market | Chart of the Month


Explore more investment insights from NS Partners.

Manager selection in Equity Long/Short Strategies
Why identifying skilled managers early, securing capacity and maintaining disciplined manager selection can influence long-term outcomes.

AI is changing everything but may not change long-term equity market returns
What previous technological revolutions can teach investors about AI, market expectations and long-term equity returns.

Explore all Chart of the Month insights →


This content is provided for information purposes only and does not constitute investment advice, an offer, solicitation or recommendation to buy or sell any financial instrument or investment product.

The views and opinions expressed are those of NS PARTNERS SA at the date of publication and may change without notice. References to specific securities, sectors or market developments are provided for illustrative purposes only and should not be interpreted as investment recommendations or investment research.

Past performance does not predict future returns. The value of investments and the income derived from them may fluctuate and investors may not recover the amount originally invested. Investments involve risks, including possible loss of capital.

References to market indices, benchmarks or other measures of relative market performance are provided for information purposes only. NS PARTNERS SA makes reasonable efforts to ensure the accuracy of the information contained herein but provides no warranty or representation as to its completeness or accuracy.

Some entities of the NS Partners Group or their clients may hold positions in the financial instruments mentioned or may act as advisor to related issuers.

This content may not be distributed or used in any jurisdiction where such distribution or use would be contrary to local laws or regulations. Additional information is available upon request.

© NS Partners Group
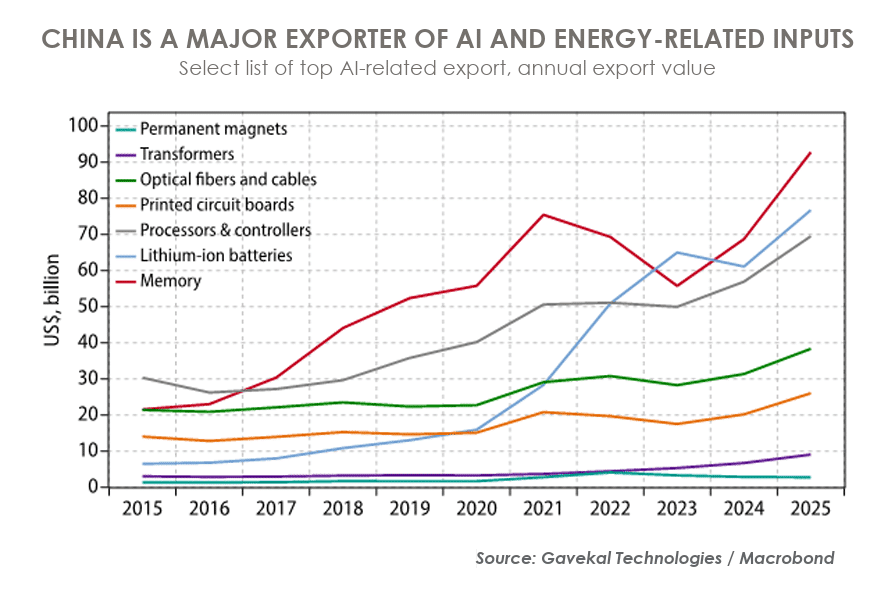
Chart of the Month: China’s Hidden AI Advantage

China’s Hidden AI Advantage

Annual export value of AI and energy-related inputs from China including memory, lithium-ion batteries, processors, transformers and optical fibres.
Chinese manufacturers are key suppliers of components required for data centres, electricity networks and AI infrastructure. Source: Gavekal Technologies / Macrobond.


Artificial Intelligence is often viewed through the lens of software companies, advanced semiconductors and frontier AI models. Yet one of the most underappreciated consequences of the AI revolution is the unprecedented demand for physical infrastructure.

As AI adoption accelerates and data centres expand around the world, the beneficiaries extend far beyond the developers of AI models themselves. Increasing computing requirements are creating significant demand for electrical equipment, networking components, cooling systems, batteries and energy infrastructure. This month’s Chart of the Month highlights an important investment theme: the global AI boom is creating substantial opportunities for Chinese manufacturers positioned across the infrastructure value chain.

The Infrastructure Behind Artificial Intelligence

The construction of AI-ready data centres requires enormous quantities of equipment and industrial inputs. Power infrastructure, cooling technologies, networking components, printed circuit boards, batteries, industrial automation systems and precision manufacturing equipment all play a critical role in supporting next-generation computing capacity.

Many of these segments are areas where Chinese companies have developed significant production capacity and global market share. As a result, even if China does not dominate the most advanced AI models, it is well positioned to capture value from the infrastructure buildout required to support the AI revolution.

Financial Markets Are Recognising the Opportunity

The scale of this opportunity is reflected in current investment plans.

Industry estimates suggest that global spending on AI-related infrastructure will reach hundreds of billions of dollars in the coming years as major technology companies continue to invest aggressively in computing capacity. Companies such as Microsoft, Amazon, Google and Meta are expanding their infrastructure footprints to support growing demand for AI-powered applications and services.

Importantly, this trend extends beyond advanced semiconductors. The expansion of AI infrastructure creates demand for a broad range of industrial products, including power distribution systems, cooling technologies, electrical equipment, grid components and energy solutions. Consequently, a much wider group of businesses stand to benefit from the global AI investment cycle.

Energy: A Critical Component of the AI Boom

One of the most important dimensions of AI infrastructure is energy.

AI workloads consume significantly more electricity than traditional computing applications, increasing demand for grid upgrades, power transmission, renewable energy assets and energy storage solutions. This is particularly relevant for China, which has established leadership positions in batteries, solar panels, electrical equipment and power electronics.

As governments and corporations invest to meet rising electricity demand generated by AI applications, these industries could experience sustained growth. The AI investment cycle therefore extends well beyond software and overlaps closely with several of China’s core industrial strengths.

A Broader AI Ecosystem

The chart also illustrates a broader shift in the technology landscape.

Historically, technological breakthroughs often generated the greatest benefits for innovation leaders. In the AI era, however, value creation is distributed across a much larger ecosystem involving both software and hardware providers. Every AI model ultimately relies on physical infrastructure for training, deployment and operation.

This creates what could be considered a second-order AI opportunity: investing not only in the companies developing artificial intelligence, but also in the businesses supplying the equipment required to power it.

Perhaps most importantly, this theme remains relatively resilient to uncertainty about which AI models ultimately emerge as market leaders. Whether future demand is captured by OpenAI, Anthropic, Google, xAI, DeepSeek or future entrants, the underlying requirement remains the same: more servers, more electricity, more cooling capacity, more networking equipment and more industrial infrastructure. Chinese manufacturers occupy strategic positions across many of these supply chains and may therefore benefit regardless of which AI developers ultimately prevail.

Looking Beyond Software

The AI revolution is not solely a software story.

Behind every breakthrough model lies a vast industrial ecosystem responsible for building and maintaining the physical infrastructure that makes artificial intelligence possible. As the next phase of AI development shifts from experimentation to large-scale deployment, manufacturers supplying the foundations of the digital economy may emerge among the most significant beneficiaries.

The global AI race is therefore not just about algorithms and semiconductors. It is increasingly about factories, supply chains, electrical infrastructure and industrial capacity.

Written by Gabriele Casati

Download PDF version Chart of the Month – China’s Hidden AI Advantage

This content is provided for information purposes only and does not constitute investment advice, an offer, solicitation or recommendation to buy or sell any financial instrument or investment product.

The views and opinions expressed are those of NS PARTNERS SA at the date of publication and may change without notice. References to specific securities, sectors or market developments are provided for illustrative purposes only and should not be interpreted as investment recommendations or investment research.

Past performance does not predict future returns. The value of investments and the income derived from them may fluctuate and investors may not recover the amount originally invested. Investments involve risks, including possible loss of capital.

References to market indices, benchmarks or other measures of relative market performance are provided for information purposes only. NS PARTNERS SA makes reasonable efforts to ensure the accuracy of the information contained herein but provides no warranty or representation as to its completeness or accuracy.

Some entities of the NS Partners Group or their clients may hold positions in the financial instruments mentioned or may act as advisor to related issuers.

This content may not be distributed or used in any jurisdiction where such distribution or use would be contrary to local laws or regulations. Additional information is available upon request.

© NS Partners Group
Rise of Luxury Experiences: Why Travelers Are Choosing Memories Over Material Goods

Rise of Luxury Experiences: Why Travelers Are Choosing Memories Over Material Good

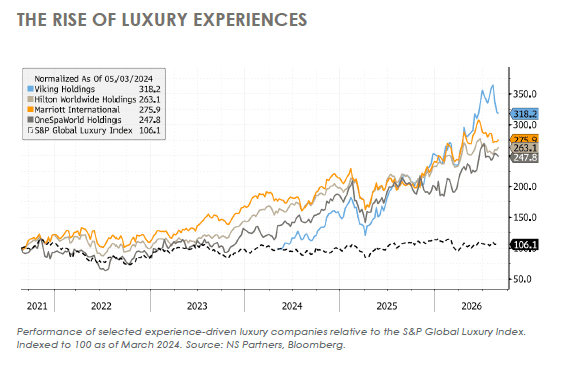
Performance of luxury experience companies versus the S&P Global Luxury Index highlighting the growth of experiential luxury.

Luxury spending has long been associated with the purchase of high-end products such as designer handbags, watches and jewellery. Yet consumer preferences are evolving. Increasingly, luxury is being defined not only by what people own, but by what they experience. Travel, wellness, personalised services and cultural enrichment have become powerful drivers of spending among affluent consumers.

Since the pandemic, this shift has accelerated. Travellers are placing greater value on meaningful experiences, personal well-being and memorable journeys. Luxury tourism revenues have already surpassed pre-pandemic levels, supported by strong demand for premium hotels, cruises and wellness retreats. Industry estimates suggest that the global luxury travel market reached approximately $1.6 trillion in 2025 and is expected to continue growing at high-single-digit rates for the foreseeable future.

Financial Markets Are Reflecting the Trend

The impact of this shift extends beyond consumer behaviour and is increasingly visible in financial markets. As illustrated in this month’s chart, companies exposed to luxury travel, hospitality and wellness experiences have significantly outperformed the broader luxury sector over the past two years, suggesting investors are recognising the strength and durability of this structural trend.

Viking Holdings: Travel as an Experience

One of the clearest beneficiaries of this trend is Viking Holdings. Unlike traditional cruise operators focused on mass-market entertainment, Viking has built its brand around destination-focused travel experiences designed for affluent travellers seeking enrichment and discovery.

The company reported revenue growth of nearly 22% in 2025, reaching $6.5 billion, while maintaining occupancy levels of around 95%. To address rising demand, Viking plans to add 27 new river ships by 2028 and 10 additional ocean ships by 2031. These investments reflect management’s confidence that demand for experiential and destination-oriented travel will remain strong.

Premium Hospitality Continues to Expand

The same trend can be observed across the luxury hotel industry.

Hilton now operates more than 500 luxury properties across brands including Waldorf Astoria, Conrad and NoMad, while continuing to expand its flagship destinations in key markets. Marriott, through brands such as Ritz-Carlton, St. Regis and JW Marriott, continues to benefit from strong global demand for premium accommodation and exclusive travel experiences. With nearly 1.8 million rooms worldwide and more than 600,000 rooms in its development pipeline, Marriott is investing heavily to capture future growth.

Both companies have highlighted a growing preference for personalised service, exclusive destinations and memorable experiences as travellers choose to spend more on unique journeys and premium hospitality.

Wellness Becomes a Core Luxury Category

Beyond transportation and accommodation, wellness has become one of the most important pillars of the luxury experience economy.

This creates a significant opportunity for OneSpaWorld, the leading provider of wellness services onboard cruise ships and at resort destinations. The company operates more than 200 wellness centres, serves over 28 million cruise guests annually and controls more than 90% of the outsourced maritime wellness market. In 2025, OneSpaWorld generated record revenue of approximately $961 million, supported by growing demand for fitness programmes, nutrition services, medi-spa treatments and broader wellness-focused experiences.

Perhaps most importantly, wellness is increasingly viewed as an integral component of luxury travel rather than an optional add-on. Consumers are seeking experiences that contribute not only to enjoyment, but also to personal well-being.

The Future of Luxury

Taken together, the success of Viking, Hilton, Marriott and OneSpaWorld highlights a profound shift in luxury consumption.

Luxury goods remain an important part of the market. However, some of the strongest growth is now coming from experiences that offer discovery, wellness and personal enrichment. Both high-net-worth individuals and younger affluent consumers are prioritising travel, cultural experiences and self-care over the acquisition of additional material possessions.

The implication is clear: the future of luxury may be defined less by what people own and more by where they go, what they experience and how those experiences enrich their lives.

Written by Maria Hernandez Sanchez

Download PDF version: Chart of the Month_September 2026

This content is provided for information purposes only and does not constitute investment advice, an offer, solicitation or recommendation to buy or sell any financial instrument or investment product.

The views and opinions expressed are those of NS PARTNERS SA at the date of publication and may change without notice. References to specific securities, sectors or market developments are provided for illustrative purposes only and should not be interpreted as investment recommendations or investment research.

Past performance does not predict future returns. The value of investments and the income derived from them may fluctuate and investors may not recover the amount originally invested. Investments involve risks, including possible loss of capital.

References to market indices, benchmarks or other measures of relative market performance are provided for information purposes only. NS PARTNERS SA makes reasonable efforts to ensure the accuracy of the information contained herein but provides no warranty or representation as to its completeness or accuracy.

Some entities of the NS Partners Group or their clients may hold positions in the financial instruments mentioned or may act as advisor to related issuers.

This content may not be distributed or used in any jurisdiction where such distribution or use would be contrary to local laws or regulations. Additional information is available upon request.

© NS Partners Group
Artificial Intelligence is changing the world. But will it change long-term equity market returns?

Artificial intelligence Is Changing the World. But Will It Change Long-Term Equity Market Returns?

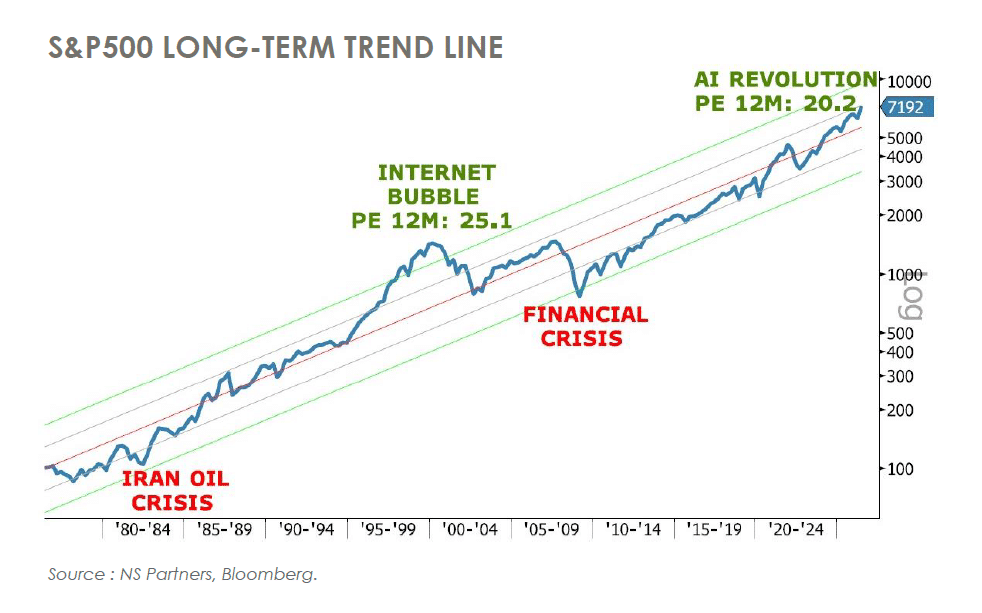
S&P 500 long-term trend showing major technological revolutions including the PC, Internet, Cloud, Smartphone and Artificial Intelligence.


Artificial Intelligence is transforming industries, reshaping business models and accelerating productivity across the global economy. Many investors therefore assume that AI will also permanently increase stock market returns. But history tells a more nuanced story. Looking back at previous technological revolutions—from the personal computer and the Internet to cloud computing and smartphones—provides valuable perspective on what AI may, and may not, mean for long-term investors.rtificial Intelligence is transforming industries, reshaping business models and accelerating productivity across the global economy.

Many investors therefore assume that AI will also permanently increase stock market returns. But history tells a more nuanced story. Looking back at previous technological revolutions—from the personal computer and the Internet to cloud computing and smartphones—provides valuable perspective on what AI may, and may not, mean for long-term investors.

Artificial Intelligence Is Changing the World. But Will It Change Long-Term Equity Market Returns?

Since 1976, the S&P 500 has lived through the personal computer (1981), the World Wide Web (1991), the Internet boom (1995), cloud computing (2006), the smartphone revolution (2007), and now Artificial Intelligence (2022).

Each of these innovations changed the world. Consumers benefited enormously. Productivity increased. Entire industries emerged while others disappeared. Joseph Schumpeter described this process as creative destruction: old technologies and business models fade away, new ones take their place, and living standards improve. AI may prove no different. 

The late 1990s provide a useful reminder. During the dot-com bubble, many investors believed the Internet had permanently changed the rules of investing. In many ways, it did change the economy. The Internet transformed commerce, communication and productivity. Yet after the bubble burst, the S&P 500 gradually returned to its long-term trend, as illustrated in the chart. Few investors would have predicted this outcome in 1999.

At first glance, this may seem counterintuitive. If technological revolutions reshape the economy, why don’t they permanently change the long-term return of the equity market?

The answer is simply Economics 101. A technological advantage attracts competition. Competitors adopt the innovation, barriers to entry gradually decline, and profit margins normalise over time. While a handful of companies may generate extraordinary returns, much of the economic value created by innovation ultimately accrues to consumers through better products, lower prices and higher productivity, rather than to shareholders.

Artificial Intelligence is today’s great technological revolution. It will undoubtedly create winners and losers, disrupt industries and transform the way businesses operate. But for the overall market, history suggests that this time may not be different. The long-term trend of the S&P 500, around 10.5% per year, is already remarkable. Investors should not assume that AI will permanently change the slope of that trend.

Written by ANGEL SANZ

Download PDF version AI Is Changing the World. But Will It Change Long-Term Equity Market Returns?

This content is provided for information purposes only and does not constitute investment advice, an offer, solicitation or recommendation to buy or sell any financial instrument or investment product.

The views and opinions expressed are those of NS PARTNERS SA at the date of publication and may change without notice. References to specific securities, sectors or market developments are provided for illustrative purposes only and should not be interpreted as investment recommendations or investment research.

Past performance does not predict future returns. The value of investments and the income derived from them may fluctuate and investors may not recover the amount originally invested. Investments involve risks, including possible loss of capital.

References to market indices, benchmarks or other measures of relative market performance are provided for information purposes only. NS PARTNERS SA makes reasonable efforts to ensure the accuracy of the information contained herein but provides no warranty or representation as to its completeness or accuracy.

Some entities of the NS Partners Group or their clients may hold positions in the financial instruments mentioned or may act as advisor to related issuers.

This content may not be distributed or used in any jurisdiction where such distribution or use would be contrary to local laws or regulations. Additional information is available upon request.

© NS Partners Group
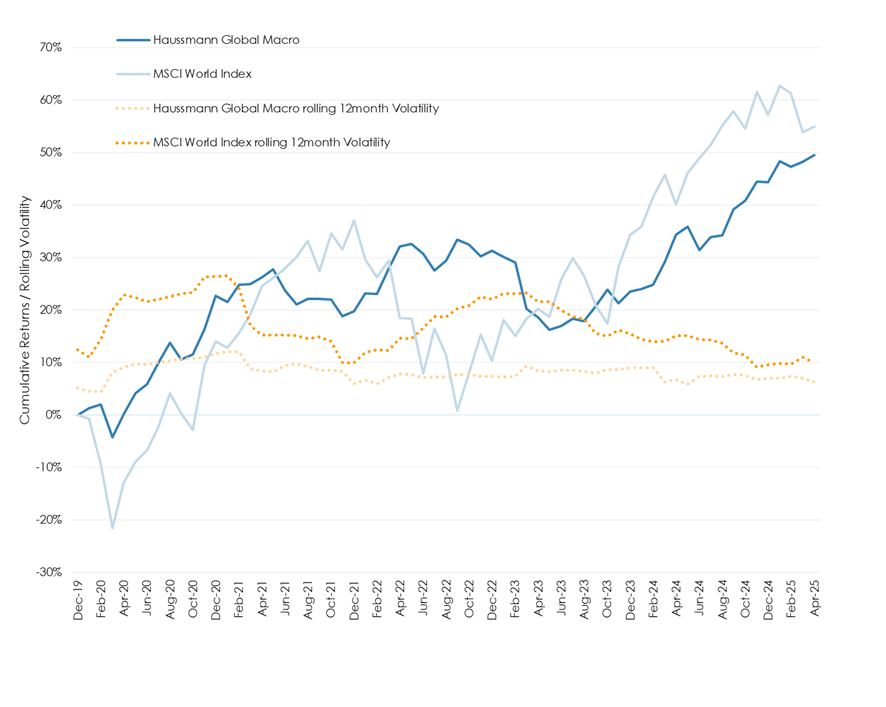
Chart of the month: Bubble or Bull? Why not a Bubbull?

Bubble or Bull? Why not a Bubbull?

The current mindset in the investment community is rather binary when it comes to the S&P 500. Either people speak about a bubbly market about to collapse, or about a steady and strong-footed bull market thanks to the AI cycle.

It is honestly difficult to bet the farm on the first or on the latter. US equities, and consequently global equities, as the US makes up roughly 70% of the MSCI World, are supported by impressive profit growth from its leaders, almost all technology related. At the same time, the strong performance recorded by the S&P 500 came with a significant increase in valuations, which are now close to the highest levels of the last 25 years, and getting closer to the late 90s tech bubble.

We, at NS Partners, are as torn between optimism and skepticism as the other market participants. The merits of the big Information Technology leaders and their exposure to AI are undeniable; likewise, their immense profit and cash-flow generation are nothing short of impressive. But, at the same time, valuations matter; they always did and will always do. And today valuations are very demanding; not outrageous, but very demanding. And we see many signs of speculative positioning all around the place, like the lofty returns posted by numerous non-profitable businesses.

The chart of the month shows 100 years of history for the S&P 500. If the latter might appear overextended at this point, reflecting its spectacular run of the last 10 years, it is by no means a call for a fall. The pattern was quite similar in the mid-90s, right before it literally shot up to the upside before the infamous tech bubble finally burst. Being absent from equities back then, before the collapse, was very painful.

We must admit visibility is very limited at this point. The bull market is here and well alive, while we witness flashing lights as we observe multiple bubbly signals in the current environment. A bubble and a bull? Let’s call this a Bubbull for now…


Past performance is not indicative of future results. The views, strategies and financial instruments described in this document may not be suitable for all investors. Opinions expressed are current opinions as of date(s) appearing in this material only. References to market or composite indices, benchmarks or other measures of relative market performance over a specified period of time are provided for your information only. NS Partners provides no warranty and makes no representation of any kind whatsoever regarding the accuracy and completeness of any data, including financial market data, quotes, research notes or other financial instrument referred to in this document. This document does not constitute an offer or solicitation to any person in any jurisdiction in which such offer or solicitation is not authorized or to any person to whom it would be unlawful to make such offer or solicitation. Any reference in this document to specific securities and issuers are for illustrative purposes only, and should not be interpreted as recommendations to purchase or sell those securities. References in this document to investment funds that have not been registered with the FINMA cannot be distributed in or from Switzerland except to certain categories of eligible investors. Some of the entities of the NS Partners Group or its clients may hold a position in the financial instruments of any issuer discussed herein, or act as advisor to any such issuer.  Additional information is available on request.
© NS Partners Group

Chart of the month: US economic consensus 2025 less good than expected

US economic consensus 2025 less good than expected


Donald Trump’s November 2024 election victory sparked optimism for a revitalized US economy, with expectations of good GDP growth and a reduction in the hefty budget deficit inherited from the Biden administration. Equity markets soared after Election Day, signaling confidence in Trump’s economic agenda. The initial Bloomberg Consensus for 2025 projected GDP growth at 2.2%, with hopes of fiscal discipline to tackle the long-standing deficit challenge.

Yet, Trump’s tariff obsession, marked by “Tariffs Day” in April 2025, defied David Ricardo’s free trade principles, creating a lose-lose scenario. The updated 2025 consensus reveals a GDP growth drop to 1.4% and a core PCE inflation spike to 3.0%, reflecting expected short-term inflationary pressures. This tariff-driven approach has disrupted global trade, stifled growth, decreased corporate profits and raised consumer costs, undermining the early economic optimism.

The situation deteriorated further with the first draft of Trump’s “Big Beautiful Bill,” which unexpectedly widened the budget deficit disappointing investors who anticipated fiscal restraint. While tariff revenues may partially offset the deficit, the bill has hampered DOGE’s (Department of Government Efficiency) efforts to curb spending. Rising concerns over sustained borrowing have caught the attention of bond vigilantes, pushing US 30-year government bond yields to 5.0%.

The 2025 consensus now paints a less rosy picture: GDP growth at 1.4%, higher inflation (set to ease in 12-18 months), and a persistent -6.5% budget deficit. This has weakened the dollar, driven interest rates higher, left equity markets flat, and fueled uncertainty among consumers and corporations.

However, Trump has shown a willingness to pivot when needed, so we may see tariff reductions and a revised “Big Beautiful Bill” that better aligns with market expectations, potentially easing some of these economic strains.


Past performance is not indicative of future results. The views, strategies and financial instruments described in this document may not be suitable for all investors. Opinions expressed are current opinions as of date(s) appearing in this material only. References to market or composite indices, benchmarks or other measures of relative market performance over a specified period of time are provided for your information only. NS Partners provides no warranty and makes no representation of any kind whatsoever regarding the accuracy and completeness of any data, including financial market data, quotes, research notes or other financial instrument referred to in this document. This document does not constitute an offer or solicitation to any person in any jurisdiction in which such offer or solicitation is not authorized or to any person to whom it would be unlawful to make such offer or solicitation. Any reference in this document to specific securities and issuers are for illustrative purposes only, and should not be interpreted as recommendations to purchase or sell those securities. References in this document to investment funds that have not been registered with the FINMA cannot be distributed in or from Switzerland except to certain categories of eligible investors. Some of the entities of the NS Partners Group or its clients may hold a position in the financial instruments of any issuer discussed herein, or act as advisor to any such issuer.  Additional information is available on request.
© NS Partners Group

Time to perform differently – Global Macro

Time to perform differently: Global macro


Markets are shifting, and fast. Since late 2024, volatility’s up and equities are struggling. But global macro strategies? They’re thriving. Same returns, less risk. Half the volatility, negative correlation, and real resilience. At Haussmann, we now allocate over 25% to macro. Why? Because when markets get unstable, macro performs. It’s time to think differently and perform differently.


Cédric Dingens, Head of Alternative Investments


Past performance is not indicative of future results. The views, strategies and financial instruments described in this document may not be suitable for all investors. Opinions expressed are current opinions as of date(s) appearing in this material only. References to market or composite indices, benchmarks or other measures of relative market performance over a specified period of time are provided for your information only. NS Partners provides no warranty and makes no representation of any kind whatsoever regarding the accuracy and completeness of any data, including financial market data, quotes, research notes or other financial instrument referred to in this document. This document does not constitute an offer or solicitation to any person in any jurisdiction in which such offer or solicitation is not authorized or to any person to whom it would be unlawful to make such offer or solicitation. Any reference in this document to specific securities and issuers are for illustrative purposes only, and should not be interpreted as recommendations to purchase or sell those securities. References in this document to investment funds that have not been registered with the FINMA cannot be distributed in or from Switzerland except to certain categories of eligible investors. Some of the entities of the NS Partners Group or its clients may hold a position in the financial instruments of any issuer discussed herein, or act as advisor to any such issuer.  Additional information is available on request.
© NS Partners Group

Chart of the month: Time to perform differently – Global Macro

Time to perform differently: Global macro

Source: NS Partners, Bloomberg


In our previous “Chart of the Month” from September 2024, titled “Time to Reassess Market Risks,” we noted early signs of fragility in global market structures. Since then, markets have trended lower and become more volatile, driven primarily by Trump’s trade war and persistent geopolitical tensions.

By late 2024, one of our strongest convictions was the growing attractiveness of global macro strategies. These managers generate returns by identifying broad economic and political trends, such as shifts in interest rates, inflation, currency dynamics or global risk factors, and positioning portfolios accordingly across a diverse set of asset classes, including equities, bonds, currencies and commodities.

The accompanying chart highlights the performance and volatility of our global macro managers in Haussmann versus the MSCI World Index since 2020. While the equity market returned an impressive +55% over that period, our macro managers delivered comparable performance, with far greater resilience.

Crucially, the rolling volatility of the global macro strategy was roughly half that of equity markets and significantly more stable. Whereas market volatility peaked near 30%, macro volatility rarely exceeded 10%. From a portfolio construction standpoint, this is compelling: the strategy’s correlation to equities was only 0.18 and its downside capture was -7%, meaning it generally performed positively during equity market drawdowns.

Today, global macro represents more than 25% of Haussmann’s capital allocation. We take confidence in the long-standing strength of our top three macro allocations: Caxton, Castle Hook and Gemsstock which have been part of our portfolio for many years.

We are now operating in a market environment that is increasingly macro-driven. Trade tensions and tariff-related uncertainty continue to suppress risk appetite and heighten volatility. While we are not advocating an exit from equities, positive surprises remain possible, we strongly believe this is the time to complement portfolios with strategies that offer greater resilience and positive convexity.


Past performance is not indicative of future results. The views, strategies and financial instruments described in this document may not be suitable for all investors. Opinions expressed are current opinions as of date(s) appearing in this material only. References to market or composite indices, benchmarks or other measures of relative market performance over a specified period of time are provided for your information only. NS Partners provides no warranty and makes no representation of any kind whatsoever regarding the accuracy and completeness of any data, including financial market data, quotes, research notes or other financial instrument referred to in this document. This document does not constitute an offer or solicitation to any person in any jurisdiction in which such offer or solicitation is not authorized or to any person to whom it would be unlawful to make such offer or solicitation. Any reference in this document to specific securities and issuers are for illustrative purposes only, and should not be interpreted as recommendations to purchase or sell those securities. References in this document to investment funds that have not been registered with the FINMA cannot be distributed in or from Switzerland except to certain categories of eligible investors. Some of the entities of the NS Partners Group or its clients may hold a position in the financial instruments of any issuer discussed herein, or act as advisor to any such issuer.  Additional information is available on request.
© NS Partners Group

Chart of the Month: April 2025 Inflation & Yield Curve Risks

Chart of the Month:
Inflation and the Yield Curve This Chart of the Month examines whether inflation is truly transitory and what the recent steepening of the US yield curve signals for markets.

April 2025 Inflation & Yield Curve – Chart of the Month


Is the inflation transitory this time?

At the press conference after the last FED meeting on Wednesday 19th of March, FED chairman Jerome Powell, used the infamous T word to describe the impact that tariff would have on inflation in the short term. While he could well be right, the use of the term “transitory” for describing inflation was very bold as it revives fresh memories of what is probably the worst monetary policy mistake of this decade.

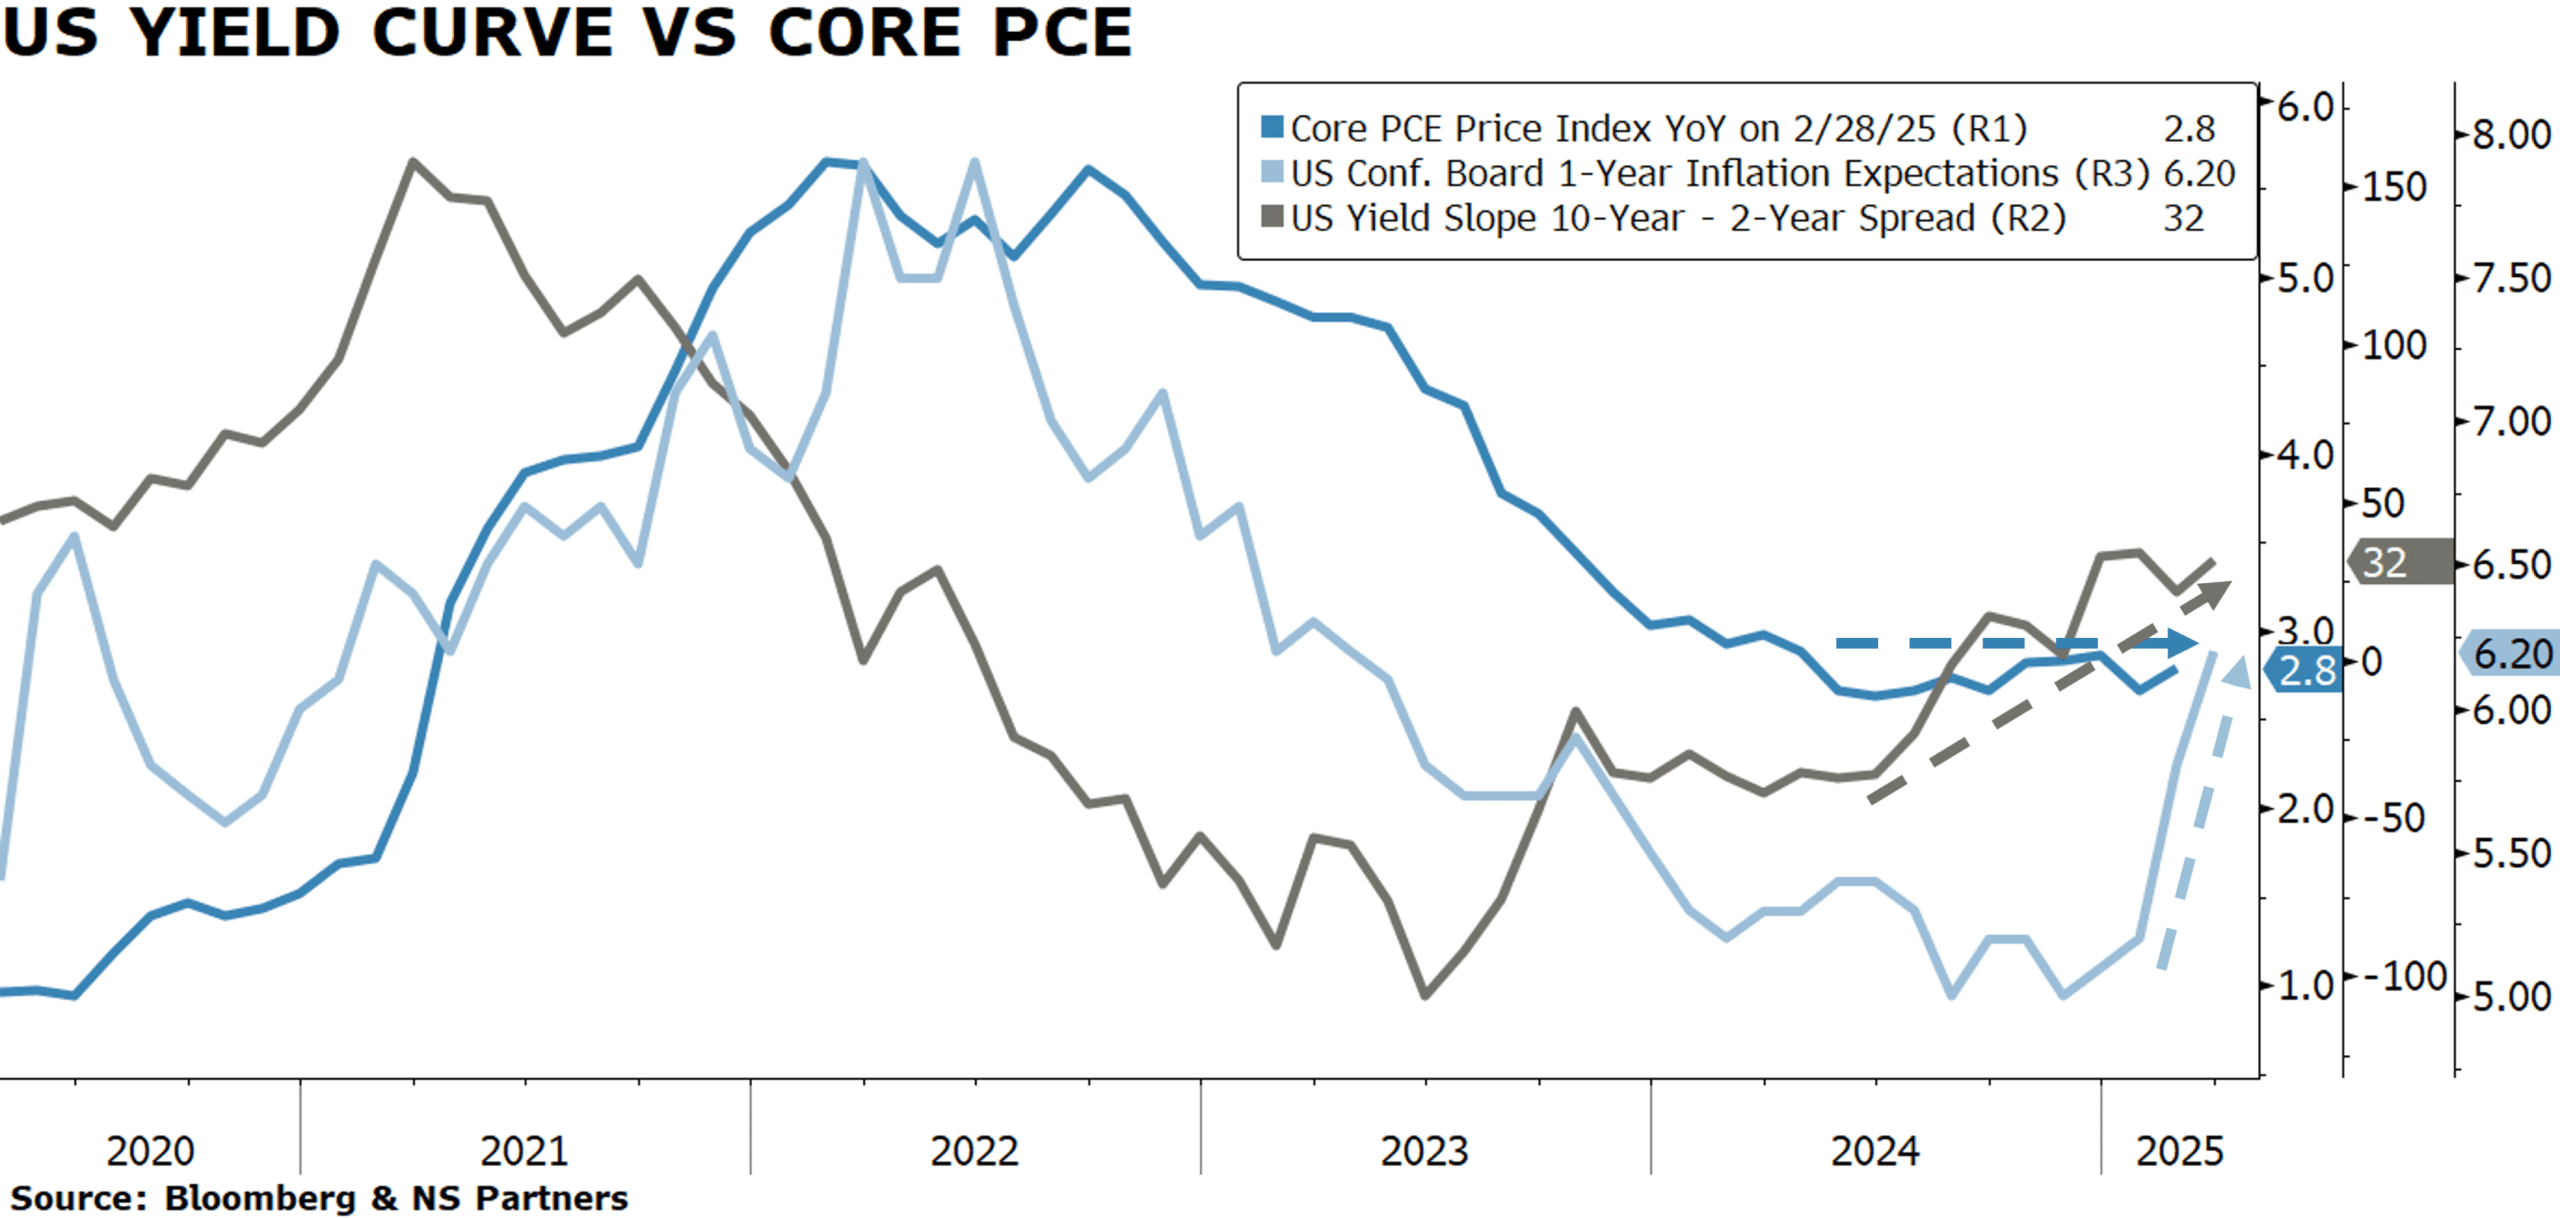
The FED preferred measure for inflation, the core PCE price index (the dark blue line in the chart) was at 2.8% in February on a year over year basis. This level is not alarming in itself. What is more concerning however is that the inflation has not made further progress since May last year (as reflected by the dark blue arrow on the chart) while still being above the 2% FED target.

As the US growth is showing some signs of weakness and the FED made it clear that they view the recent elevated inflation numbers as only a short-term impact from tariffs, the bond market is pricing 3 FED cuts for the year, which would take the FED fund rate at 3.75% in December.

What does it mean for future inflation and the yield curve? Since the start of the year, the inflation expectations one year from now (the light blue line in the chart) has rebounded from 5% to 6.2% as consumers are getting worried of price hikes. Since inflations expectations tend to be self-fulfilling prophecies, this could trigger an upshot in the core PCE price index.

The yield curve can be approximated by the difference between the 10-year nominal yield and the 2-year nominal yield (the dark grey line in the chart). This measure has gone from -36 bps to +32 bps since last May when disinflation progresses stalled (as shown by the dark grey arrow). And as one of the major drivers for its slope is the inflation uncertainty, we could be witnessing the start of a bear steepening, where the 10-year nominal yield rises faster than the 2-year yield.

This is very important because we have seen previously that a steepening yield curve tend to lead to credit spreads widening (which started this year) and ultimately recessions. While we are not calling for a recession in the US just yet, it is becoming a greater risk amid political uncertainty.

Therefore, stay careful with your credit exposure and watch out for the curve steepening!


Past performance is not indicative of future results. The views, strategies and financial instruments described in this document may not be suitable for all investors. Opinions expressed are current opinions as of date(s) appearing in this material only. References to market or composite indices, benchmarks or other measures of relative market performance over a specified period of time are provided for your information only. NS Partners provides no warranty and makes no representation of any kind whatsoever regarding the accuracy and completeness of any data, including financial market data, quotes, research notes or other financial instrument referred to in this document. This document does not constitute an offer or solicitation to any person in any jurisdiction in which such offer or solicitation is not authorized or to any person to whom it would be unlawful to make such offer or solicitation. Any reference in this document to specific securities and issuers are for illustrative purposes only, and should not be interpreted as recommendations to purchase or sell those securities. References in this document to investment funds that have not been registered with the FINMA cannot be distributed in or from Switzerland except to certain categories of eligible investors. Some of the entities of the NS Partners Group or its clients may hold a position in the financial instruments of any issuer discussed herein, or act as advisor to any such issuer.  Additional information is available on request.
© NS Partners Group

Chart of the month: Asia, the alpha opportunity

Asia: the alpha opportunity


Source: Morgan Stanley Fund Services, MSCI


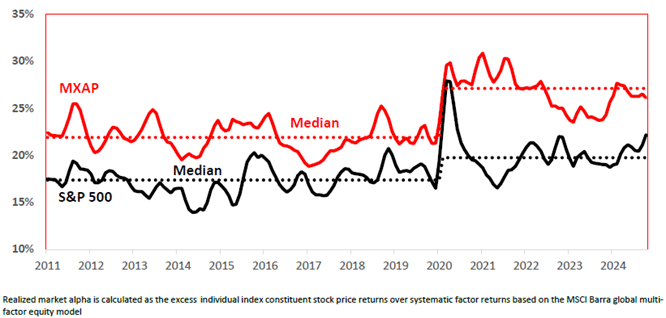
Since the onset of COVID-19, dispersion in the US and Asia has significantly increased, with Asia continuing to show higher levels. This accounts for the superior performance of Long/Short strategies in recent years, especially in Asia, where there are more opportunities to go long on high performers and short underperformers, allowing these strategies materialize in stock returns.

Over the past decade, Asia’s expanding market size, liquidity, and sector depth have led to a greater diversity in returns, providing an often-overlooked source of alpha opportunities. Many stocks remain under-researched or misunderstood due to local barriers such as language, culture, and regulations. Historically, Asia was seen as a growth market, with cyclical foreign investor flows mainly chasing market beta. However, Asian markets are now evolving into a diverse investment landscape, where fundamental stock selection is becoming increasingly rewarding.

The return composition of Asian equities is becoming more alpha-driven, with stock selection playing an increasing critical role. This is essential in an environment where performance bifurcation within industries has become more pronounced. Following a period of systematic beta decline, markets are now finding strong support levels. Concurrently, improved policy clarity and stability in the economy are boosting confidence in stock selection, allowing investors to focus more on fundamentals rather than tail-end events.

Our strategy: the equity Long/Short multi-manager approach offers the right diversification for investors looking to reallocate capital to the region. Managers have been performing well this year. Since we began investing in the region, we’ve had the opportunity to allocate capital to managers who have successfully protected capital during downturns while generating strong returns in rising markets, benefiting from good asymmetric returns.

The regional market structure is shifting from beta-driven to alpha-driven opportunities. To capitalize on this, we must quickly adapt to the new investment environment with an agile approach. Managers using a Variable Net hedge fund approach provide the necessary flexibility. Overall, we favor active investments over passive ones. Passive investments, such as ETFs, fail to capture the new economic trends, while active long-only funds are less dynamic in adjusting exposure to the right sectors to seize market opportunities.


Past performance is not indicative of future results. The views, strategies and financial instruments described in this document may not be suitable for all investors. Opinions expressed are current opinions as of date(s) appearing in this material only. References to market or composite indices, benchmarks or other measures of relative market performance over a specified period of time are provided for your information only. NS Partners provides no warranty and makes no representation of any kind whatsoever regarding the accuracy and completeness of any data, including financial market data, quotes, research notes or other financial instrument referred to in this document. This document does not constitute an offer or solicitation to any person in any jurisdiction in which such offer or solicitation is not authorized or to any person to whom it would be unlawful to make such offer or solicitation. Any reference in this document to specific securities and issuers are for illustrative purposes only, and should not be interpreted as recommendations to purchase or sell those securities. References in this document to investment funds that have not been registered with the FINMA cannot be distributed in or from Switzerland except to certain categories of eligible investors. Some of the entities of the NS Partners Group or its clients may hold a position in the financial instruments of any issuer discussed herein, or act as advisor to any such issuer.  Additional information is available on request.
© NS Partners Group