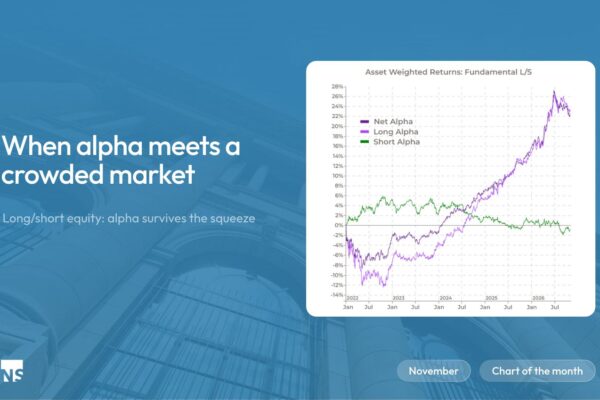

Three takeaways from recent conversations with institutional investors in Paris.
Recent discussions with institutional investors in Paris repeatedly came back to the same question: after several years of strong equity returns, what is really driving markets today?
Global equity indices remain close to record highs, supported by two powerful long-term investment cycles: artificial intelligence and the energy transition. Yet beneath the surface, the picture is becoming more complex. Market leadership has narrowed, capital expenditure is absorbing more cash flow and earnings expectations leave increasingly little room for disappointment.
Taken together, these developments suggest that headline index performance is becoming less informative about what is happening at individual company level.
A Long Investment Cycle, but Rising Expectations
Today’s equity cycle continues to benefit from substantial productive investment. Digitalisation and artificial intelligence have accelerated a trend that began with the expansion of cloud computing in the early 2010s. At the same time, higher energy costs and the energy transition continue to support spending on power generation, grids and industrial infrastructure.
History also shows that major investment cycles rarely move in a straight line. The industrial expansion of 1915-1929, the post-war consumption cycle of 1954-1972 and the technology boom of 1982-2000 all suffered significant setbacks without immediately derailing their underlying investment trends.
That perspective matters today.
Investment by hyperscalers is accelerating at an extraordinary pace. Capital expenditure expectations for 2026 have risen from around USD 300 billion at the end of 2024 to nearly USD 800 billion, with annual spending projected to reach USD 1.1-1.2 trillion by 2030.
The question is therefore evolving. Investors are increasingly looking beyond how much is being spent on AI to ask what returns this investment will ultimately generate.
The shift is already changing the economics of some of the world’s largest technology companies. According to the underlying analysis, Microsoft’s gross property, plant and equipment rose from USD 32 billion in 2015 to USD 323 billion in 2026. As a percentage of revenue, that represents a rise from 35% to 115%.
This echoes a question explored in our recent Insight, Markets Are Not Pricing a Bubble. They Are Pricing an Earnings Revolution: with corporate earnings rising alongside markets, the debate increasingly centres on whether this level of profit growth can be sustained.
Valuations Tell Only Part of the Story
Despite concerns surrounding record market levels, aggregate valuations do not currently point to broad-based excess.
The global median 12-month forward price-to-earnings ratio stands between 16 and 17 times, broadly in line with its historical average since 2000. Across several sectors, earnings have also grown faster than share prices, resulting in multiple compression rather than expansion.
The more demanding question is whether today’s earnings momentum can persist.
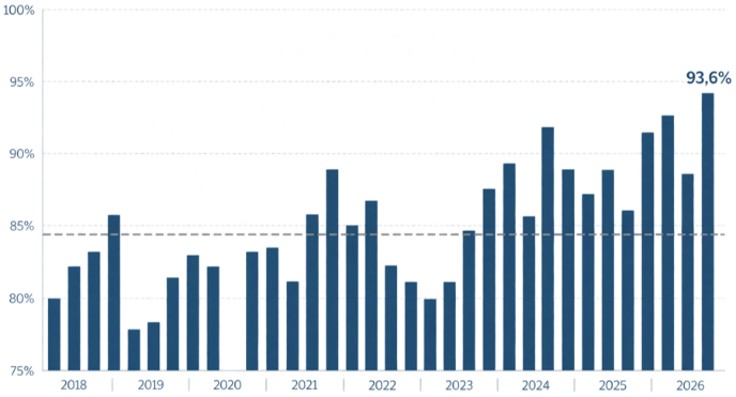
Nearly 94% of US companies have met or exceeded earnings expectations, compared with a historical average of around 84%. Such a high success rate is encouraging, but it also raises the bar for future reporting periods.
Chart 1 | Share of S&P 500 Companies Meeting or Beating EPS Estimates
Sources: Citi Wealth, Bloomberg, as of 10 August 2026.
Some recently reported profits among technology leaders have also included non-recurring accounting gains related to changes in the valuation of private holdings such as OpenAI and Anthropic.
In an environment of already elevated expectations, a slowdown in underlying earnings growth could therefore matter more than today’s headline valuation multiples suggest.
Behind the Records, an Increasingly Narrow Market
Perhaps the most striking development is happening beneath the indices.
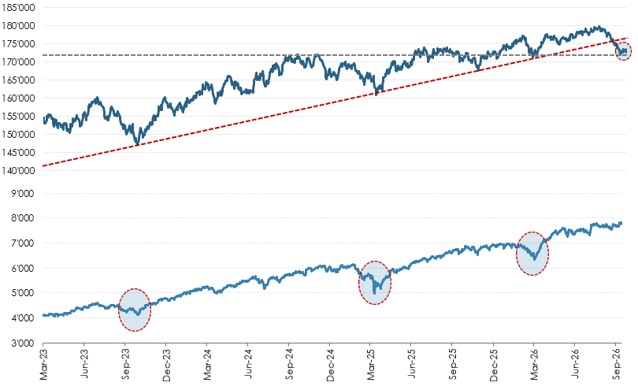
While major US benchmarks have continued to reach new highs, participation among their constituents has deteriorated. The cumulative NYSE Advance/Decline Line has moved sharply lower, while approximately 80% of US-listed stocks were trading below their 50-day moving average at the time of the analysis.
Put differently, the indices and the average stock are increasingly telling different stories.
Chart 2 | NYSE Advance/Decline Line and S&P 500
Sources: NS Partners, Bloomberg, as of 13 October 2026.
This divergence can eventually normalise in different ways. Mega-cap leaders could correct, lagging stocks could catch up, or leadership could rotate towards previously overlooked sectors.
Predicting which path markets will take is less useful than recognising the dispersion itself. When index performance depends heavily on a small number of companies, understanding individual earnings, cash-flow generation, balance sheets and valuations becomes increasingly relevant.
AI Investment Is Moving into the Real Economy
This dispersion is also becoming apparent within the AI theme itself.
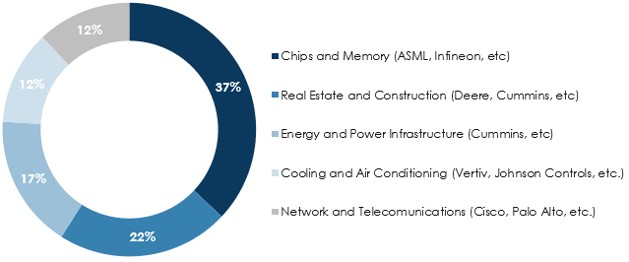
Investors are increasingly recognising that AI-related capital expenditure does not flow exclusively towards semiconductor designers and the largest technology platforms. According to the underlying analysis, less than 40% relates directly to computing power. More than 60% is flowing into industrial and traditional parts of the economy.
Civil engineering and construction account for approximately 22% of announced spending, followed by power and energy distribution infrastructure at 17%, cooling and air-conditioning systems at 12%, and network and telecommunications infrastructure at 12%.
Chart 3 | Where AI-Related Capital Expenditure Is Going
Source: NS Partners, as of 30 August 2026.
This broadening is bringing a different set of companies into the AI investment cycle, including businesses involved in power equipment, energy management, low-carbon electricity, cooling, construction and communications infrastructure. Some already benefit from multi-year order books and recurring maintenance revenues.
AI is therefore becoming less useful as a simple sector label. The more interesting questions are increasingly specific: where is the spending actually going, which companies can convert that demand into sustainable earnings and cash flows, and how much of that opportunity is already reflected in valuations?
Stock Picking Comes Back into Focus
The common thread across these observations is dispersion.
Earnings remain strong, but expectations are demanding. AI investment continues to expand, but its beneficiaries are becoming more diverse. Major indices remain close to record levels, while participation beneath them has narrowed considerably.
In such an environment, an index alone tells us less about the underlying market. The more revealing questions sit at company level: which businesses can sustain earnings growth, which can turn investment demand into durable cash flows, and where have market expectations moved too far?
That is where stock picking comes back into focus.
Related Insights
For a deeper look at the earnings dynamics behind today’s equity markets, read our recent Insight, Markets Are Not Pricing a Bubble. They Are Pricing an Earnings Revolution. The analysis explores how strong earnings growth and the AI investment cycle are reshaping the debate around market valuations.
Past performance is not indicative of future results. The views, strategies and financial instruments described in this document may not be suitable for all investors. Opinions expressed are current opinions as of the date(s) appearing in this material only. References to market or composite indices, benchmarks or other measures of relative market performance over a specified period of time are provided for your information only.
NS Partners provides no warranty and makes no representation of any kind whatsoever regarding the accuracy and completeness of any data, including financial market data, quotes, research notes or other financial instruments referred to in this document.
This document does not constitute an offer or solicitation to any person in any jurisdiction in which such offer or solicitation is not authorized or to any person to whom it would be unlawful to make such offer or solicitation. Any reference in this document to specific securities and issuers are for illustrative purposes only, and should not be interpreted as recommendations to purchase or sell those securities.
References in this document to investment funds that have not been registered with the Finma cannot be distributed in or from Switzerland except to certain categories of eligible investors. Some of the entities of the NS Partners group or its clients may hold a position in the financial instruments of any issuer discussed herein, or act as advisor to any such issuer.
Additional information is available on request.
© NS Partners Group