Daniel Kahneman, the Nobel Prize in Economic Sciences in 2002, wrote a best-selling book entitled “Thinking, Fast and Slow”. The central thesis of the book is that human beings have two modes of thought: System 1: Fast, instinctive and emotional; System 2: Slow, deliberative and logical. We can say that System 1 resembles the PERCEPTION, whereas, System 2 is closer to the REALITY. Being so fast and so emotional, sometimes the PERCEPTIONS may distort or exaggerate the news delivered by the market, whereas REALITY gives the investor a medium-long term framework to better assess the market situation.
Discover our monthly series “Perception vs. Reality”!

PERCEPTION
The common wisdom says that the relative performance of emerging markets is linked to the performance of commodities, so some investors may think that “betting” on emerging markets might be similar to “betting” on commodities. The thought process behind this is that some of the big oil exporters are based in emerging markets, like the Arabian Gulf countries, Russia, Venezuela, Nigeria, Libya, Mexico, etc. Also, some of the big exporters of industrial metals, grain, etc are Brazil, South Africa, Russia, Argentina, etc. Simultaneously, developed markets are the consumers of all of those commodities. The naïve conclusion can be: “if commodities prices go up, so will emerging market equities”.
REALITY
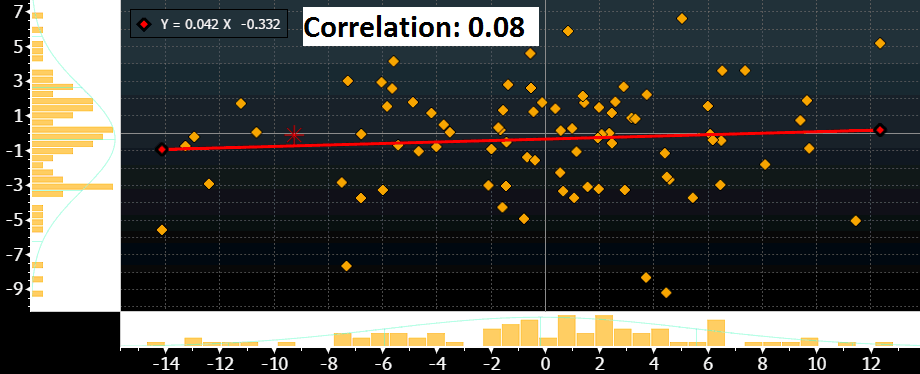
The graph above shows the correlation between the relative performance of MSCI Emerging Markets $ (vs MSCI Developed Markets $) vs. the GS Commodity Spot Index for the last 7 years. The correlation between them was 0.08, What a surprise! Or not!
A macro view to explain this zero correlation: The table 1 below shows the top 8 countries in the emerging markets world, and the four most important (China, India, Korea and Taiwan) all are importing commodities. What is even more meaningful is that India and China have been increasing their weights in the indexes and they benefit from lower commodity prices.
| Weight Index | Trade Balance | |
| China | 25.8 | Importer |
| South Korea | 14.7 | Importer |
| Taiwan | 11.9 | Importer |
| India | 8.1 | Importer |
| Brazil | 7.4 | Exporter |
| South Africa | 7.1 | Exporter |
| Mexico | 4.0 | Exporter |
| Russia | 3.6 | Exporter |
An equity sector view to explain this zero correlation: Table 2 shows the weight of the different sectors in both the MSCI Developed Markets and MSCI Emerging Markets. Coherent with the macro view, we can see that commodity related equities are 14.1% of Emerging Markets vs. 11.6% of Developed Markets. The small 2.5% weight difference is irrelevant. Besides, with Chinese equities increasing its weight in the indexes this small difference will soon be reduced to 0%. The large oil exporting countries (Saudi Arabia, Iraq, Iran, Venezuela, etc) contribute to small amount in the indexes.
| MSCI World Developed Markets | MSCI Emerging Markets | |
| Materials | 4.9 | 6.8 |
| Energy | 6.7 | 7.3 |
| Industrials | 11.1 | 6.1 |
| Consumer Discretionary | 12.6 | 10.6 |
| Consumer Staples | 10.8 | 7.9 |
| Health Care | 13.2 | 2.3 |
| Information Technology | 14.7 | 23.2 |
| Financials | 19.2 | 26.6 |
| Telecommunications | 3.5 | 6.5 |
| Utilities | 3.3 | 2.7 |
| TOTAL | 100.00 | 100.00 |
CONCLUSION
The market is more rational than what investors think. If the large emerging markets are net importers of commodities, then the indexes should have a small exposure to commodity companies and so the correlation with commodities should be low, which happens to be the case.
Now that emerging market equities are becoming more attractive with large inflows, investors should take their decision to invest or not in emerging markets on other macro and micro data like GDP growth, inflation, monetary policy, regulation, etc.