
Chart of the Month – China: an interesting risk/return profile to be exposed to the region.
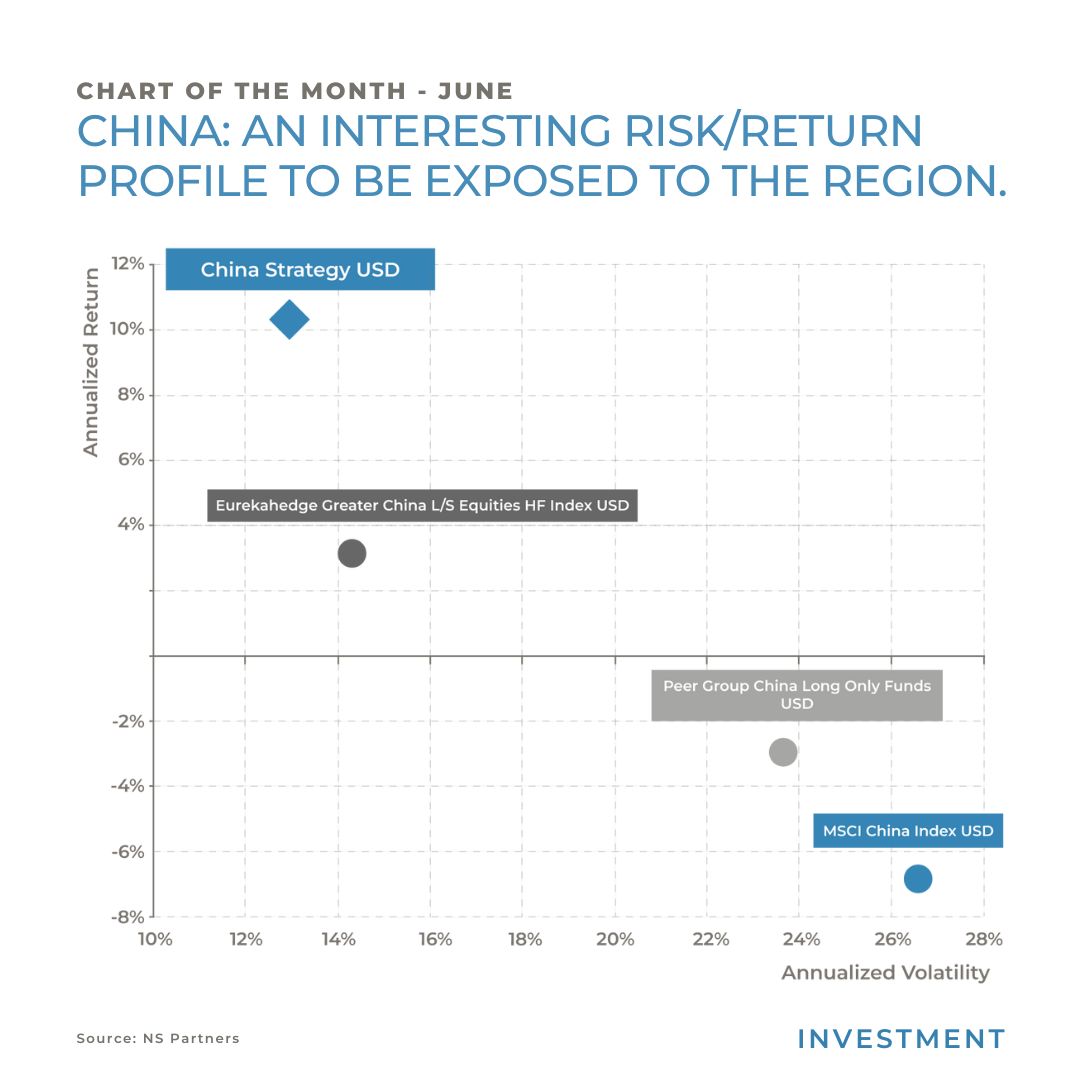
China: an interesting risk/return profile to be exposed to the region.
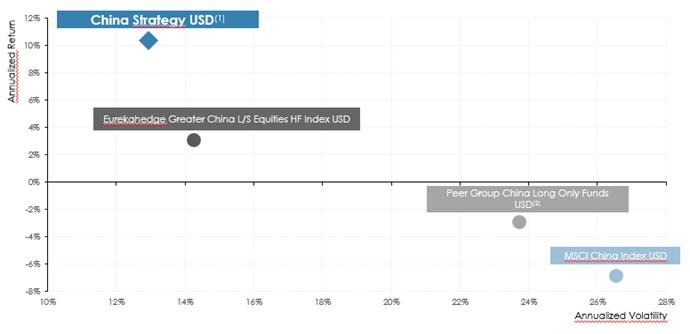
Source: NS Partners, Bloomberg. Data as of 30 April 2024. Performance in USD. Risk statistics against the MSCI China Index USD calculated on a monthly basis, with a risk-free rate of 1.0%.
(1) China B USD = Haussmann China/Asia Equity Long/Short allocation (K USD Share Class, with 1.40% management fees) from 31 December 2017 to 31 March 2021. From 1 April 2021 real track record of Mahjong China Fund B USD, net of fees. (2) Peer Group = long only China equity funds discretionary selected by NS Partners (10 funds), equally-weighted and rebalanced on a monthly basis. This slide includes historic returns and past performance is not a reliable indicator of future results. The value of investments can go down as well as up.
After 3 years of bear market in China, I see structural alpha opportunities emerging this year and managers are starting to gradually re-allocate capital in the region.
TMT stocks are the most net bought this year, information technology is the most overweight sector in this region. The financial sector remains the most underweight sector in the region, it has seen net inflows YTD but is among the most underweight ones in China.
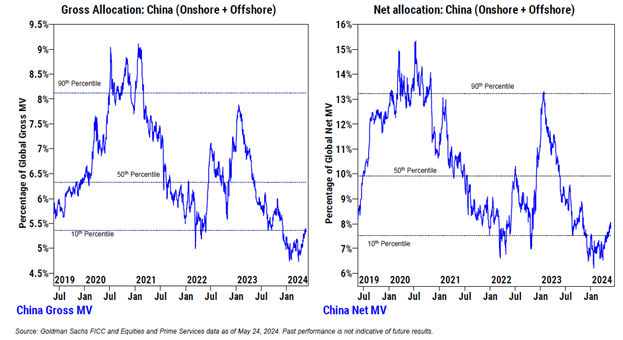
Chinese equities continue to see slow but steady buying, with net buying flows. H shares have led the recent inflows followed by ADRs. A-shares continue to be net sold. But the most important Gross and Net allocation is gradually increasing.
Our strategy: China equity L/S multi-managers strategy can give the right diversification to investors that are willing to re-allocate capital to the region.
Managers are generating good performance so far this year. Since we started investing in the region, we had the ability to allocate capital with managers that were able to protect the capital in the down market and to generate good results in up market given good asymmetric returns.
The market in the region is structurally changed, moving from beta to alpha opportunities, thus we need to adopt rapidly to new investments regime and we need to be nimble in our approach; managers using Variable Net hedge fund approach can give the right flexibility. Overall, we prefer active investment over passive ones. Passive investments (ETFs) don’t follow the new trends that the economy is generating and active long only funds are less dynamic to move the exposure to the right sectors to capture market opportunities.
The return composition of the Chinese equities market is becoming more Alpha dominant. Stock selection has become a key driver in an environment where bifurcation of stock performance within an industry is a more common occurrence and it has also happed on a greater magnitude. After a period of systematic beta downtrend, markets are settling at a level of relatively strong support. At the same time, further clarity and stability across the economy and policy direction improve conviction level on stock selection, allowing investors to shift focus away from tail-end events and back into fundamentals.
China’s economy pivoted from export-manufacturing driven during 2000-2010, to domestic-consumption driven in 2010-20. It started another major rebalancing 2-3 years ago, amid the geopolitical tensions and its demographic challenges, to focus on self-reliance and advanced manufacturing.
Building a portfolio of local hedge fund managers adopting different strategies is the right approach to generate good risk-return performance. The universe of managers in China is big, there are hundreds of funds, manager selections is a key component.
The last 3 years was a big stress test for the managers, market experienced one of the worst drawdowns in history and I’m really convinced that from this period of bear market that big opportunities can emerge.
Past performance is not indicative of future results. The views, strategies and financial instruments described in this document may not be suitable for all investors. Opinions expressed are current opinions as of date(s) appearing in this material only. References to market or composite indices, benchmarks or other measures of relative market performance over a specified period of time are provided for your information only. NS Partners provides no warranty and makes no representation of any kind whatsoever regarding the accuracy and completeness of any data, including financial market data, quotes, research notes or other financial instrument referred to in this document. This document does not constitute an offer or solicitation to any person in any jurisdiction in which such offer or solicitation is not authorized or to any person to whom it would be unlawful to make such offer or solicitation. Any reference in this document to specific securities and issuers are for illustrative purposes only, and should not be interpreted as recommendations to purchase or sell those securities. References in this document to investment funds that have not been registered with the FINMA cannot be distributed in or from Switzerland except to certain categories of eligible investors. Some of the entities of the NS Partners Group or its clients may hold a position in the financial instruments of any issuer discussed herein, or act as advisor to any such issuer. Additional information is available on request.
© NS Partners Group
Article tagged by: