Chart of the month: Bubble or Bull? Why not a Bubbull?
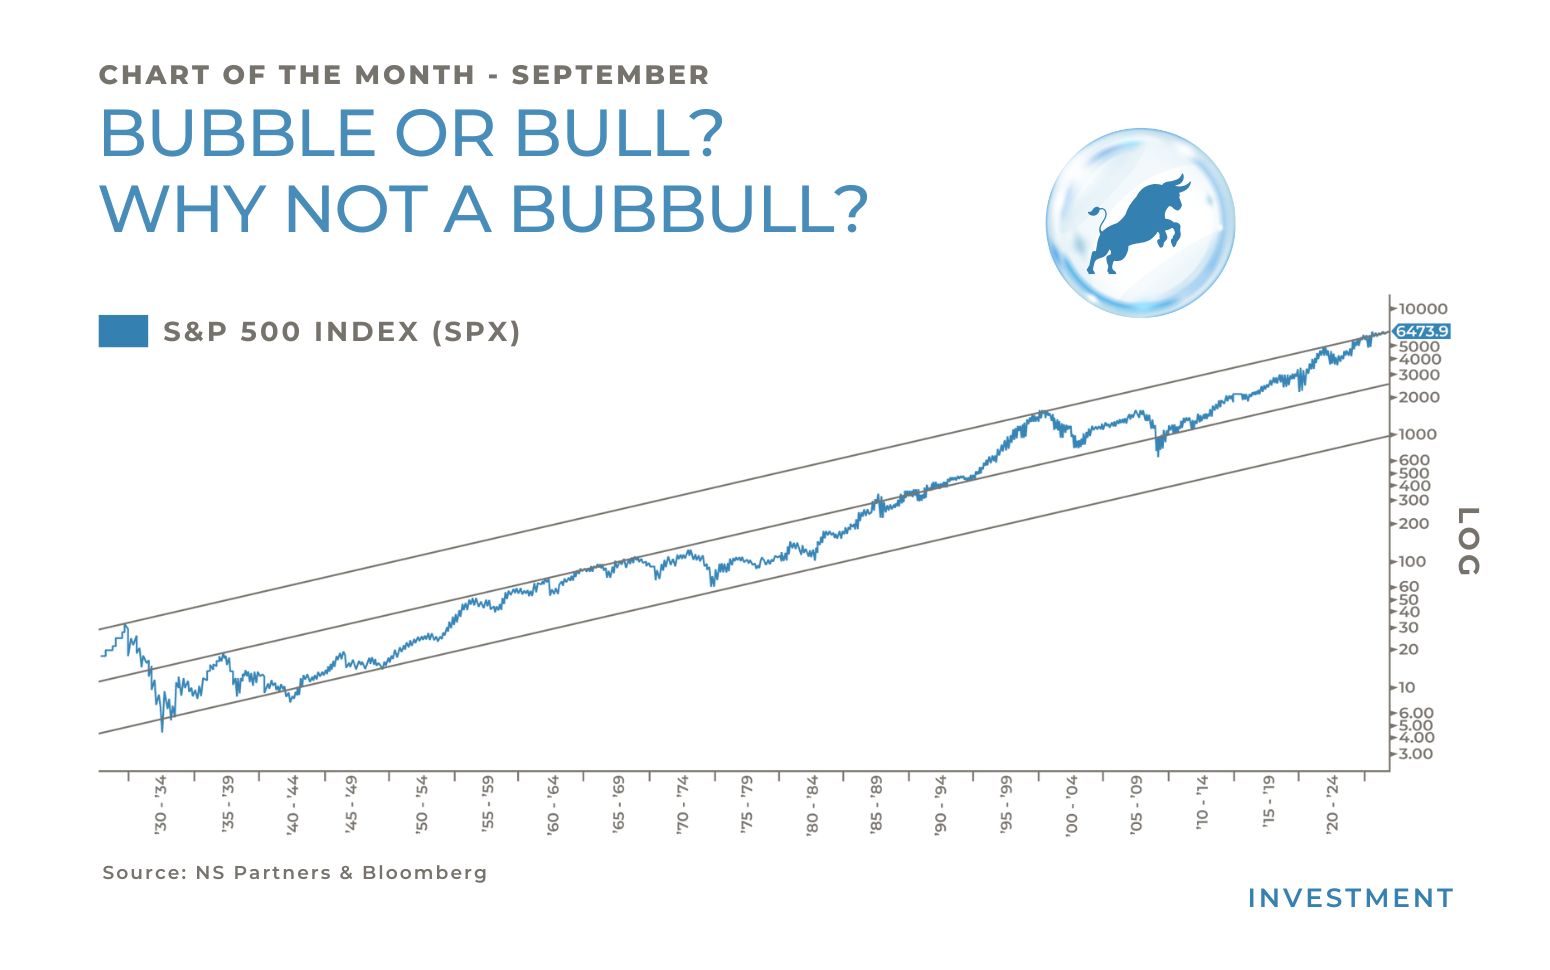
Bubble or Bull? Why not a Bubbull?
The current mindset in the investment community is rather binary when it comes to the S&P 500. Either people speak about a bubbly market about to collapse, or about a steady and strong-footed bull market thanks to the AI cycle.
It is honestly difficult to bet the farm on the first or on the latter. US equities, and consequently global equities, as the US makes up roughly 70% of the MSCI World, are supported by impressive profit growth from its leaders, almost all technology related. At the same time, the strong performance recorded by the S&P 500 came with a significant increase in valuations, which are now close to the highest levels of the last 25 years, and getting closer to the late 90s tech bubble.
We, at NS Partners, are as torn between optimism and skepticism as the other market participants. The merits of the big Information Technology leaders and their exposure to AI are undeniable; likewise, their immense profit and cash-flow generation are nothing short of impressive. But, at the same time, valuations matter; they always did and will always do. And today valuations are very demanding; not outrageous, but very demanding. And we see many signs of speculative positioning all around the place, like the lofty returns posted by numerous non-profitable businesses.
The chart of the month shows 100 years of history for the S&P 500. If the latter might appear overextended at this point, reflecting its spectacular run of the last 10 years, it is by no means a call for a fall. The pattern was quite similar in the mid-90s, right before it literally shot up to the upside before the infamous tech bubble finally burst. Being absent from equities back then, before the collapse, was very painful.
We must admit visibility is very limited at this point. The bull market is here and well alive, while we witness flashing lights as we observe multiple bubbly signals in the current environment. A bubble and a bull? Let’s call this a Bubbull for now…
Past performance is not indicative of future results. The views, strategies and financial instruments described in this document may not be suitable for all investors. Opinions expressed are current opinions as of date(s) appearing in this material only. References to market or composite indices, benchmarks or other measures of relative market performance over a specified period of time are provided for your information only. NS Partners provides no warranty and makes no representation of any kind whatsoever regarding the accuracy and completeness of any data, including financial market data, quotes, research notes or other financial instrument referred to in this document. This document does not constitute an offer or solicitation to any person in any jurisdiction in which such offer or solicitation is not authorized or to any person to whom it would be unlawful to make such offer or solicitation. Any reference in this document to specific securities and issuers are for illustrative purposes only, and should not be interpreted as recommendations to purchase or sell those securities. References in this document to investment funds that have not been registered with the FINMA cannot be distributed in or from Switzerland except to certain categories of eligible investors. Some of the entities of the NS Partners Group or its clients may hold a position in the financial instruments of any issuer discussed herein, or act as advisor to any such issuer. Additional information is available on request.
© NS Partners Group
Article tagged by: