Swiss Made

The Swiss equity market is a strange animal which exhibits pretty unique characteristics: in a small country in terms of size and population, no less than 4 mega multinationals are listed on the stock market, and completely distort the average metrics traditionally used to assess the attractiveness of an index. The famous 4 are Nestlé, Novartis, Roche and UBS which, combined, reach close to CHF 760 bln in market cap!
As a reminder, there are three indices for the Swiss market:
1) The SMI, composed of the largest and most liquid 20 companies.
2) The SPI, representing the broad market and composed of 212 companies.
3) The SPIEX, which is simply the SPI without the 20 stocks of the SMI.
As is often the case, there are many wonders to discover when looking under the surface. The universe of Swiss listed companies comprises many world leaders in niche products or industries, with a wide variety of specialties. Do a lot of non-Swiss investors know something about Sonova, or Belimo, or Forbo Holding? Certainly not, despite the fact that these three companies are integrated world leaders: hearing systems for Sonova, Belimo for air-volume controls and Forbo for flooring and moving systems. And these are just three examples among many others.
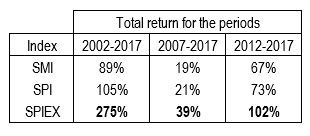
While we don’t question the strong positions of the big leaders, we think investors interested in Swiss equities would lose the most attractive part of the market by focusing on the SMI. Historical performances strongly confirm this view: the SPIEXX index has outperformed the SPI and the SMI over 5, 10 or 15 years by a wide margin. Let’s also remember that compared to other markets, these performances have been done in CHF, by far the best currency in the world.
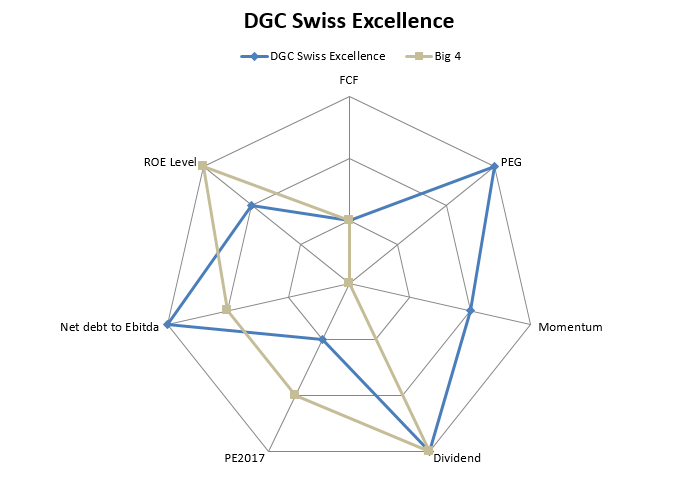
So when we manage our Swiss equity fund DGC Swiss Excellence, we pay attention to these smaller companies which are decisive contributors to investors’ returns over time. Although we invest into the larger companies, our portfolio also holds 80 companies which are not in the SMI Index. And they add value: as we focus on Price Earnings Growth, Earnings Momentum, Free Cash Flow Generation and low levels of debt, the chart of the month shows that our portfolio shows better or identical attributes than the “Big 4” for these metrics. And there’s no reason to believe it will reverse any time soon!
