High market dispersion creates alpha opportunities!

Due to the Covid-19 pandemic outbreak, 2020 is un-comparable to any other year in financial markets. Authorities in major countries in the World have taken drastic measures to save lives, which have a large negative impact on economic activity. As a response, central banks and Governments have reactivated quantitative easing and started fiscal stimulus in a big way. After having corrected by the same amplitude as in 2008 but in a space of 3-weeks, financial markets literally experienced a V-shape trajectory and are now just back in positive territory if we consider equities and the MSCI World Index. Active managers, and particularly equity long/short managers, have been able to deliver alpha, posting double-digit positive returns.
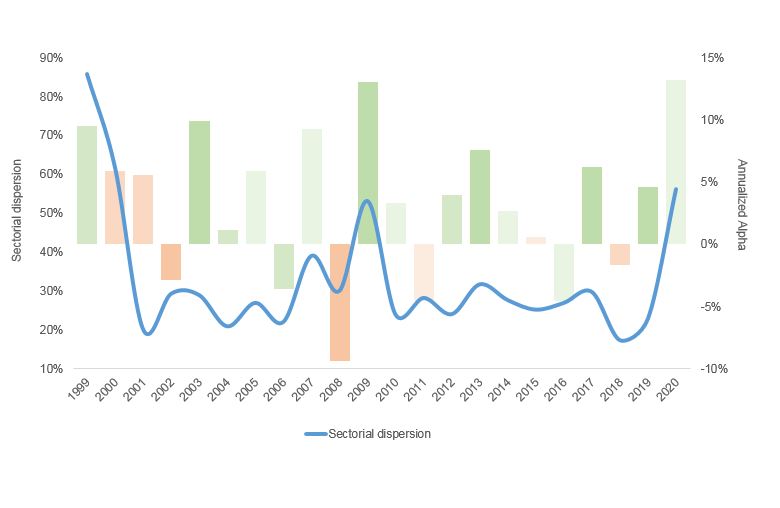
But let’s take a longer timeframe. If we consider the last 20 years, it is interesting to see the alpha generated by the Haussmann Fund versus the equity market every year and compare it to the MSCI World’s sector dispersion measured by the difference between the performance of the 2 best sectors and the 2 worst sectors. The right axis represents the alpha and if the color of the bars are green it means that market shows a positive return and when it is orange the market shows a negative return. The darker the green bars the more positive the market and vice versa.
The first conclusion is that equity long/short managers are able to generate positive alpha both in down and up markets. The second conclusion, which is more important in a way, is that there is a clear correlation between alpha and sectorial dispersion. This is particularly true when dispersion (with the measure explained above) is above 30% like in 1999 & 2000, 2009 and 2020! We believe that the market environment with high sectorial dispersion, low correlations between stocks within a sector, discrimination between winners and losers and sustained volatility, which gives good entry and exit points, remains favorable for active management in the coming quarters.
Past performance is not indicative of future results. The views, strategies and financial instruments described in this document may not be suitable for all investors. Opinions expressed are current opinions as of date(s) appearing in this material only.
References to market or composite indices, benchmarks or other measures of relative market performance over a specified period of time are provided for your information only. Notz, Stucki provides no warranty and makes no representation of any kind whatsoever regarding the accuracy and completeness of any data, including financial market data, quotes, research notes or other financial instrument referred to in this document.
This document does not constitute an offer or solicitation to any person in any jurisdiction in which such offer or solicitation is not authorized or to any person to whom it would be unlawful to make such offer or solicitation. Any reference in this document to specific securities and issuers are for illustrative purposes only, and should not be interpreted as recommendations to purchase or sell those securities. References in this document to investment funds that have not been registered with the FINMA cannot be distributed in or from Switzerland except to certain categories of eligible investors. Some of the entities of the Notz Stucki Group or its clients may hold a position in the financial instruments of any issuer discussed herein, or act as advisor to any such issuer.
Additional information is available on request.
© Notz Stucki Group