Chart of the Month – “Who you trying to get crazy with this thing? Don’t you know I’m loco?”

Chart of the month

“Who you trying to get crazy with this thing? Don’t you know I’m loco?”(*)
Hip-hop does not have a lot in common with financial markets and this 1993 song from Cypress Hill was obviously not aimed at giving any reference to any asset class whatsoever.

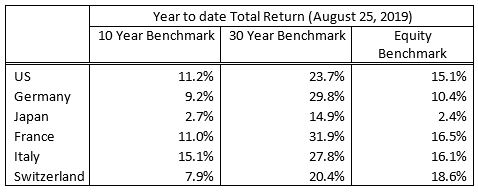
But when looking at the overall bond market today, “insane” is clearly the first word that comes to mind. To put it bluntly, how can so many investors accept to pay for holding debt securities? And why do so many market observers try to find far-fetched reasons to justify this present insane situation?

With some hindsight, it is difficult not to feel some reminiscences of the 1999 tech bubble: crazy valuations, spikes in prices, incoherent reasoning, abruptly all good reasons to buy because “things are different this time”, and in many cases the quasi-certitude to lose money over the long term. In fact, those buying German, French, Japanese or Swiss Government bonds today are sure to lose money if they hold it to maturity, whereas in 1999 at least those buying stupidly valued Internet companies could eventually have hoped to see them acquired at an even more stupid price.

In such a situation, it is unfortunately impossible to time the end of the madness, therefore extremely perilous to go short the assets that, in a logical world, should be shorted. A dear price had been paid by many brilliant investors in 1999 for having gone short the Nasdaq too early; the same applies this year with shorts on extended duration fixed income assets. But, remember how rewarding it was in 2000 to be short the Nasdaq, or at least to be away from it; it is a lesson that must be remembered.

The market will, from time to time, test convictions and drive prices far too high or far too low, much farther than most participants can cope with, which explains why there are buyers at tops and sellers at bottoms when common sense would recommend doing the opposite. Driving investors crazy and pushing them to make insane decisions is not an unusual behavior from Mr Market: “Who you trying to get crazy with this thing? Don’t you know I’m loco?”.

Coming back to today’s situation, how to deal with these negative yielding assets? For those who were brave and smart enough to hold them until now, we would advise to drastically reduce the exposure; and for the others to shy away, and concentrate on real businesses which generate cash-flow, increase earnings, invest, and are reasonably valued. Because this is the other insane consequence of abnormally low yields: how to discount future flows with incoherent factors? In theory a good company with low debt, good cash flow and an attractive dividend could be valued at insane multiples as well…

This comforts us with our positive stance towards equities, well balanced across sectors.

(*)“Insane in the brain”, Cypress Hill (https://www.youtube.com/watch?v=RijB8wnJCN0 )
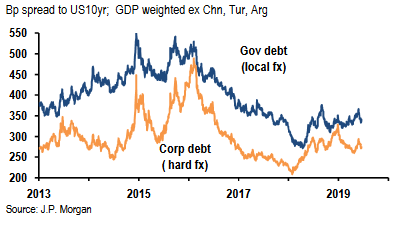
Chart of the Month – FED vs Growth for Emerging Markets

FED vs Growth for Emerging Markets

We are generally not fan of discussing EM as a single group as countries’ profiles and reaction functions are increasingly different from a country to another. But for the sake of simplification in this monthly chart we would assume so.

So which EM asset class would benefit most in the context of renewed global monetary easing? That would not only depend on short-term rates at the FED and the ECB. For EM currencies, as the FED move dovish, all major EM central banks are also expected to cut their policy rates. While the possible FED resumption of an easing cycle has recently pushed most EM currencies higher, the next leg up might take some time to materialise. The market might now wait for actual cut to materialise and growth to improve (including some sort of trade tensions resolution or truce between the US and China). The other ingredient needed to support EM currencies and local debt more generally, is inflation which in both the US and EM (collectively or individually) should stay contained.

For EM credit, a mild or even sluggish growth would be enough for the asset class to keep performing in the context of dovish central banks and contained inflation.

The real underperformer so far is EM equity and more specifically Asia Equity complex. In the case of EM equity, a higher inflation would be much better absorbed if growth rebounds and trade conflict is contained or resolved.

Chart of the Month – Is the lifecycle of the hedge fund industry over?

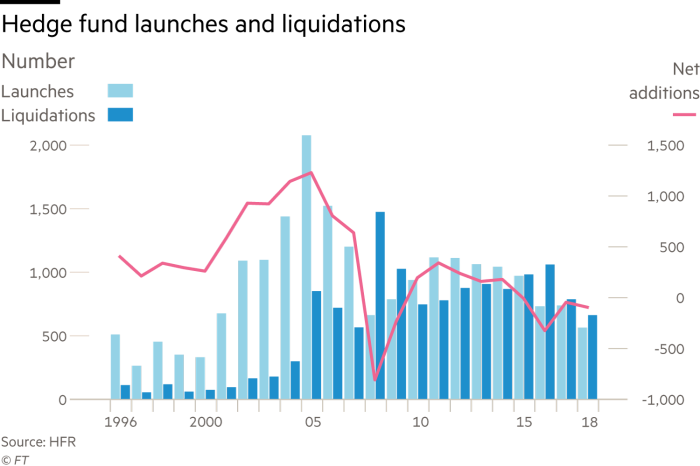
Is the lifecycle of the hedge fund industry over?

Numerous academic studies have shown that small funds outperform in their first few years of existence before they become victims of their success and subsequently attract too much money to perform in the investment strategy initially intended.

Recent history shows that an increasing number of launches are failing to gain traction and end up liquidating or long-standing managers converting into a family office after returning outside investor capital following disappointing returns (before they start outperforming again with their own money). One of the principal reasons is that the larger sized funds have become increasingly larger and competitive as they have been more successful in hiring new talent as they earn more fees. This new talent has come in the form of small and nimble investment managers that are able to actively trade limited amounts of capital within a particular sector (hence the multi-pm model with narrow stop losses e.g. Millennium, Citadel and Point72) to PhDs with a non-investment background that have been able to develop quantitative algorithms (e.g. D.E. Shaw, Renaissance and Two Sigma). The end result is that they have been able to challenge the classic old school hedge fund manager with a buy and hold approach in a concentrated portfolio of non-consensus trades with the ability to stomach volatility in exchange for outsized returns. As the traditional investor base in hedge funds has shifted from HNWI to institutional investors (endowments, SWF, pension funds etc.) that have a low tolerance to drawdowns and are happy with single digit returns, the average returns in the industry have deteriorated significantly. A declining industry is by definition less crowded which is a good thing for existing managers and the barriers to entry are much higher today than they have ever been.

At Notz Stucki, we pride ourselves in finding talented managers that are off the radar of large investors and can deliver the punchy but volatile returns and combine these with the larger multi-PM/quant managers with whom we have had long standing relationships, to attenuate the volatility of our overall portfolios. Yes the hedge fund industry remains challenged but still offers compelling opportunities particularly when markets are volatile. The short book for the average equity long / short hedge fund has clearly been a drag on performance in the last 10 years, yet there are a few outstanding managers that continue to be successful in this space. One often forgets the fact that in the past when interest rates were much higher, the cash from the short book was a source of returns whilst now it can cost you in a negative interest rate environment making it even more challenging for the industry.

The future of the hedge fund industry is still bright but one needs to be more selective in choosing the right talented managers that will continue to outperform over time.

Chart of the Month – Something wrong? Eat chocolate.

Chart of the month

Something wrong? Eat chocolate.

Source: Bloomberg, Notz Stucki

The month of May has come with its various news, we experienced the first month in negative territory since December 2018. We had however started the year well with four consecutive positive months. May brings some questions to investors: Should I sell? Do I have to worry? … What can I do?

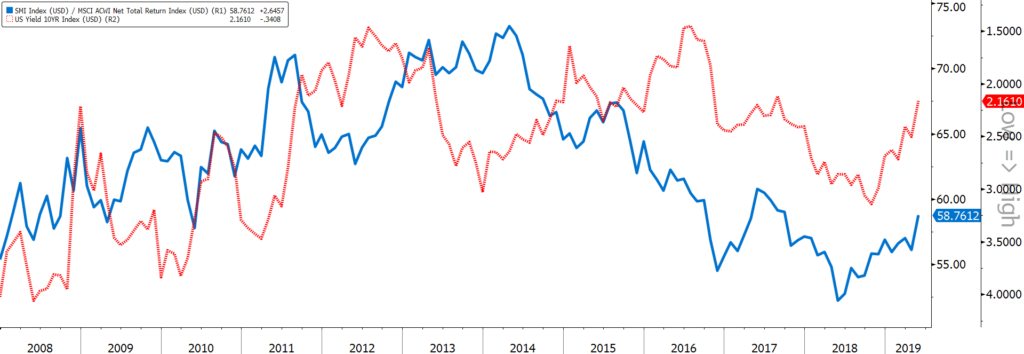
One simple action would be to increase exposure to defensive stocks. Find and invest in companies with, among others, stable earnings, low beta and constant dividend. By definition, the Swiss market has demonstrated a defensive nature over time. Links exist between movements on the US yields and world equity markets, the impact could be more or less significant. In the graph above, over an eleven-year window, we find the 10-year US yield on an inverted scale and the ratio Swiss market over the MSCI All Country World Index. The trend has been reversed since mid-2018: the Swiss market outperforms the world index. We notice that lately when yields go down in US (in our example the 10-year) Swiss market performs and since mid-2018 much better in relative terms.

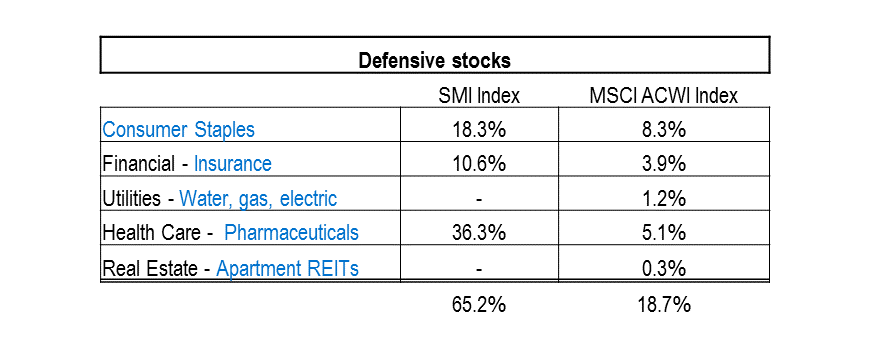
One step further, what is the actual composition of the Swiss market? Is it really defensive compared to MSCI All Country World Index? Analysis focused on the major Swiss Index: SMI Index. We selected the sectors and subsectors that have a defensive nature, this means Consumer Staples, Insurance, Water, Gas and Electric-related companies, Apartment REITS and Pharmaceuticals, excluding Biotech companies. Results are straightforward: Swiss market detains more Consumer Staples (18.3% against 8.3%), more Insurance companies (10.6% against 3.9%), more Pharma (36.3% against 5.1%) than the MSCI All Country World Index and there is no exposure to Utilities – Water, Gas and Electric-related companies or Apartment REITS. The large Swiss exposure to Staples and Pharma through Nestlé, Roche and Novartis is well known, however, the exposure to insurance and therefore the overexposure to the world index is probably not as well-known.

To conclude, more than half of the Swiss market, i.e. 65.2% is composed by defensive stocks versus 18.7% for the World Index. If we extend the analysis to the SPI Index, as the Swiss market is full of specific and niche companies, results are similar. We do not specially expect a downturn and we are not ready to sell but to add defensive in one’s portfolio can be an attractive direction. Last month, Swiss stocks demonstrated resilience with a scant negative performance of -2.52% bringing the SMI’s performance to 12.99% YTD. Last but not least, it is difficult to ignore the very good performance of the king of Swiss Staples: Nestlé, at +24.75% YTD.

Chart of the Month – Sell in May and go away? or Hedge a quarter and sleep better?

Chart of the month

Sell in May and go away? or Hedge a quarter and sleep better?

Source: Bloomberg

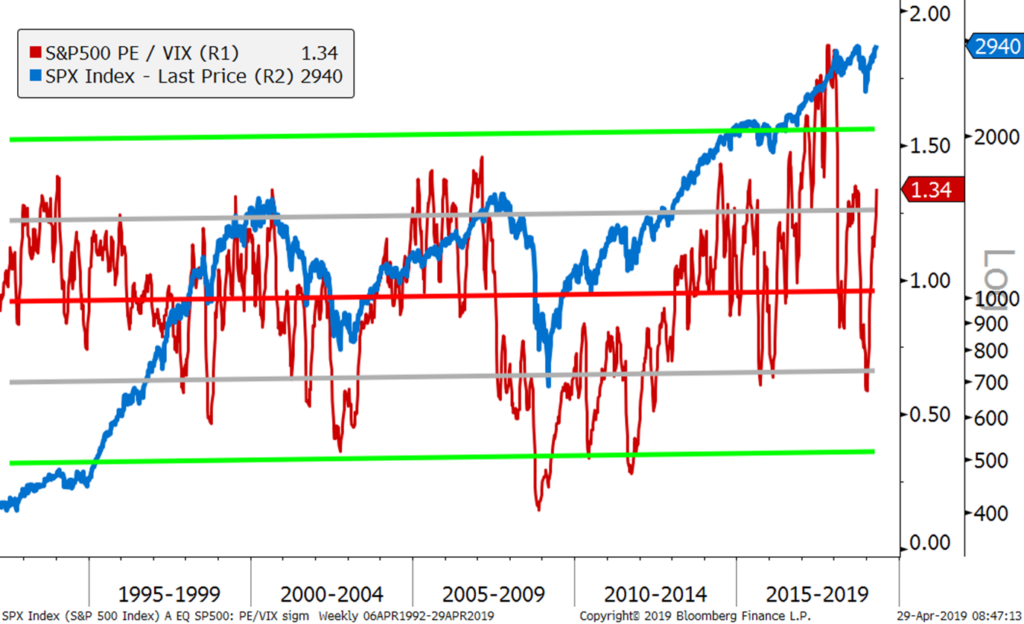
It was an extraordinary time to hedge a portfolio (or take profit) in November 2017 when the ratio S&P 500 PE/VIX reached 1.80 and was close to 3 standard deviation away from its mean (refer to our November 2017 Chart of the Month).

It was a great time to hedge a portfolio in September 2018 when this ratio reached 1.35 and was trading more than 1 standard deviation away from its mean.

After the very strong equity markets recovery this year, is it now also a good time to hedge a portfolio now that this ratio is back to 1.34 level?

Buying a put is always “too” expensive, unless your get the timing right with short maturities. It is all about finding the right balance between the underling, the maturity, the strike price and the volatility.

Whilst there are good reasons to continue to be bullish in the near term (central banks have changed policies to be more accommodative, earnings growth remain solid, global inflation is contained, trade negotiations are progressing…), we think now is a reasonable time to hedge a portfolio.

As an example: a 2% out-the-Money PUT on the S&P 500 Index with a December 20, 2019 maturity costs today about 3.3%. Therefore you can reduce your portfolio risk by 25% (or a Quarter) at a cost of 0.83%. In addition, to reduce the risk of timing, you could scale in over the next few weeks.

As the old adage says “Sell in May and Go Away”, we think it makes more sense to hedge a quarter and sleep better with an end-2019 horizon. It is a good way to remain invested with an insurance which cost is only the performance of the last 2 or 3 weeks.

Chart of the Month – Emerging Markets FX Feels Woes From Trade

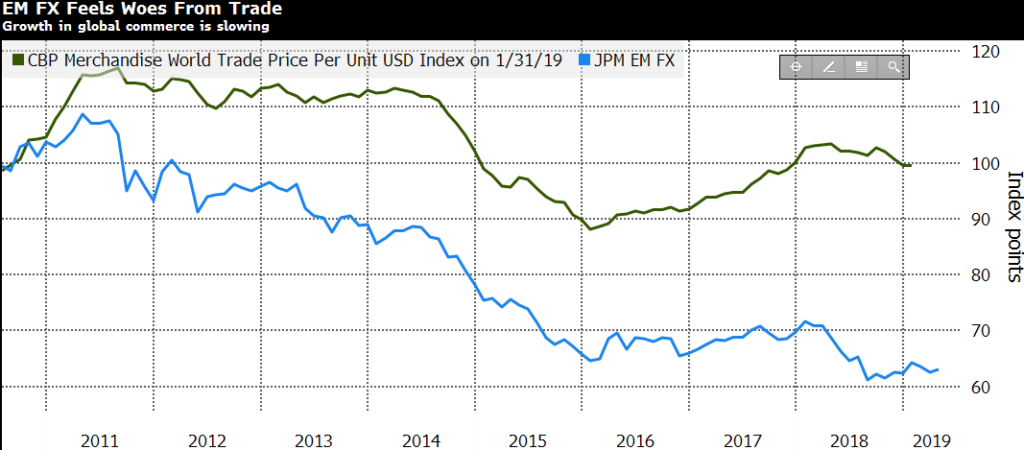
Emerging Markets FX Feels Woes From Trade

Source: CPB Netherlands Bureau for Economic Policy Analysis; Goldman Sachs; JP Morgan; Notz Stucki

The FED and the ECB have both recently turned more dovish, US 10Y yield is lower compared to the beginning of the year and is also well off its 2018 peak, China is expected to stabilise growth thanks to recently announced fiscal and monetary stimulus measures and credit spread have compressed aggressively year to date. Market expects that current trade negotiations between the US and China could at least deliver a short-term truce and potentially less tariffs.

All these factors should have been very supportive to Emerging Market (EM) currencies. So why are they lagging other asset classes in 2019 so far?

One of the reasons that could explain this underperformance is the fact that EM central banks have themselves turned dovish after the FED announced the end of Quantitative tightening. Central Banks of Brazil, Mexico, Indonesia, India, Chile, etc… have all either turned dovish or reduced their tightening bias. The only exception is central bank of Turkey which is maintaining discipline to regain credibility but even there it hasn’t paid off as the Turkish Lira performance is negative year to date.

Others possible reasons are not encouraging. As we see in our chart of the month above, there is a long-term correlation between global trade growth and the performance of EM currencies. It could be that EM currencies are telling us that we are in a persistent trend of lower trade or lower trade growth and a short-term deal between the US and China would not be a long-term game changer. EM needs a proper and long-term resolution of trade dispute which clear the outlook for global trade to resume growth.

Chart of the Month – European Financials: banking on the right stuff

European Financials: banking on the right stuff

Source: Bloomberg, Notz Stucki

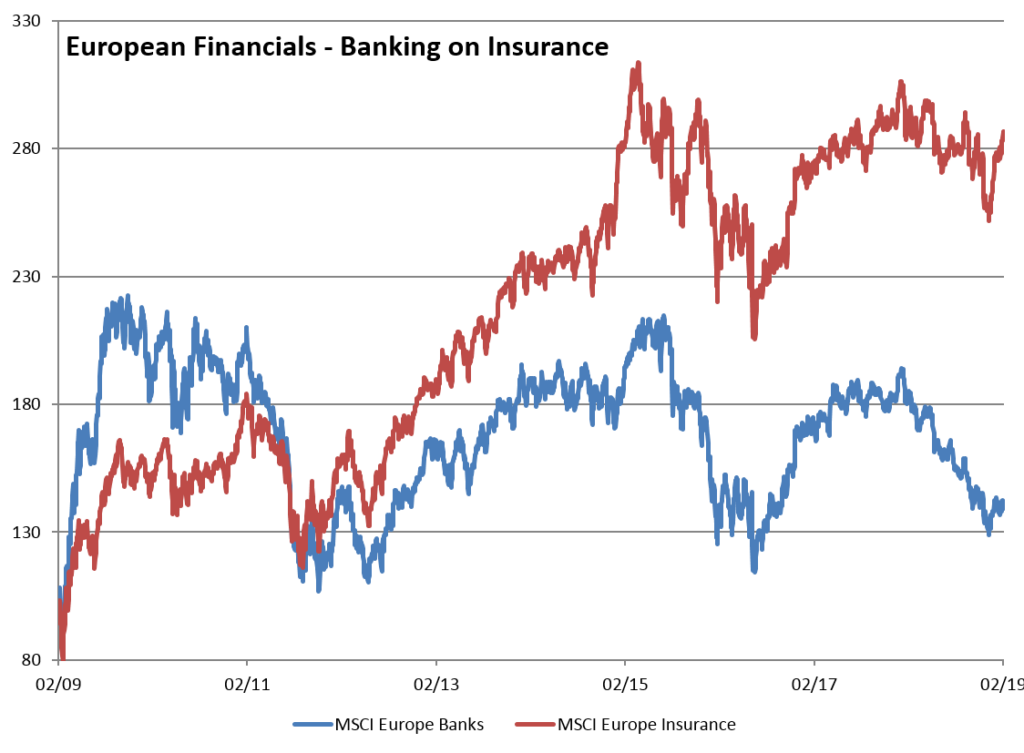
The whole financial sector in Europe has quite often been qualified as a disaster for equity investors since the GFC. It’s been now almost 10 years since the market bottomed in 2009, and an investor in European financial stocks during these 10 years has had to cope with strong headwinds and a high level of stress; remember before 2008 how fast the sector, and especially banks, rose. From the end of 2002 until the end of 2006, the European banking sector has compounded at a whopping 20.5% dividends included….

If we now turn to the last 10 years, the numbers have changed dramatically: from February 2009 until today, the sector has returned 7.5% annually with dividends (3.4% without dividends), but as can be seen on the chart of the month, timing was critical. An investor having bought the European banks index in November 2009 will have lost 1.1% annualized with dividends as of today (-4.6% without dividends), which explains the disdain expressed by many portfolio managers vis-à-vis the sector.

But financials are not made of banks only; by contrast, the Insurance sector has been on fire for the last 10 years, and even if it has been volatile, timing was far less decisive: since February 2009 the Insurance sector has returned 15.7% annually with dividends (7.6% without), and from November 2009 until today the numbers are still appealing: +11% annualized total return (+6.2% without dividends).

How has such a discrepancy been possible? Regulation, a heavy burden for the financial sector, has been much more damageable to banks as it has forced them to increase capital on a permanent basis, hampering shareholders’ returns. Another factor has obviously been the huge fines banks had to pay to US and European authorities, a casualty that has been avoided by insurers. The aftermaths of the GFC have also been more painful for banks than for insurance companies, who did not have to cope with rising non-performing loans. Many other facts are explanative, but it’s also worth mentioning the continuous difficulties of some countries in Europe, where the consanguinity between Governments and large banks is very strong…even if Insurance companies are not immune.

We still think it is possible to generate good returns with some specific banks because in some cases there’s real value, but as a longer term investment we feel much more comfortable with high quality insurance and reinsurance companies, which not only pay a good dividend, but also show resilience and growth.

Chart of the Month – How to assess the risk of an equity portfolio today?

How to assess the risk of an equity portfolio today?

Source : Cantillon, FactSet

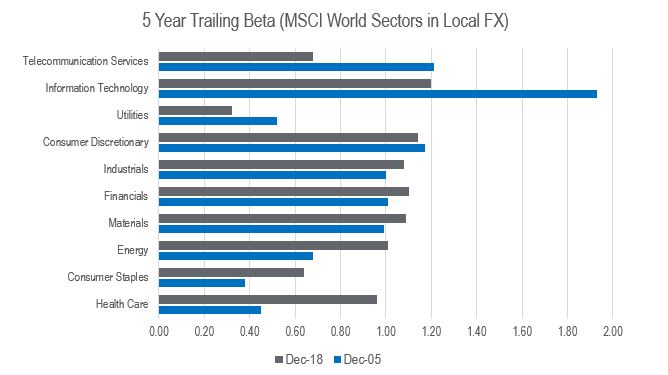
Calculating the beta has traditionally been a good way to assess the risk associated to a stock in a portfolio. The beta measures the sensitivity of the stock price to a market index. The higher the beta, the higher the amplitude of the stock price with the market on both long and short sides. In theory, having a portfolio of low beta stocks should protect you more in terms of downside during a market correction.

The issue is that, as shown in the table above, the 5 Year Trailing Beta for most sectors has significantly changed over the last 3 years. With technology disruption in action in almost all parts of the economy, some companies which belong to defensive sectors are now more vulnerable with less strong barriers to entry. Healthcare and Consumer Staples have seen the highest increase in terms of beta whereas Telecommunication Services appear as among the less risky sectors to invest in today!

The reality is that beta is only one statistic to look at and other parameters like factors and styles have more explanatory power to performance today. Momentum was the best performing factor by far until the last quarter of 2018 which saw a huge reversal. To make the story even more complex, the beta of factors are also less stable over time and record factor correlation explains the poor returns of quantitative and risk premia managers last year.

At Notz Stucki, we are well aware of factor exposures and correlations when managing our equity portfolios. But the first question we ask ourselves when we analyze a company is do we want to own this business and is it able to generate good long-term compounding returns over the years.

Chart of the Month – 2018: No place to hide to make money. 2019: Typically, reversion.

2018: No place to hide to make money. 2019: Typically, reversion.

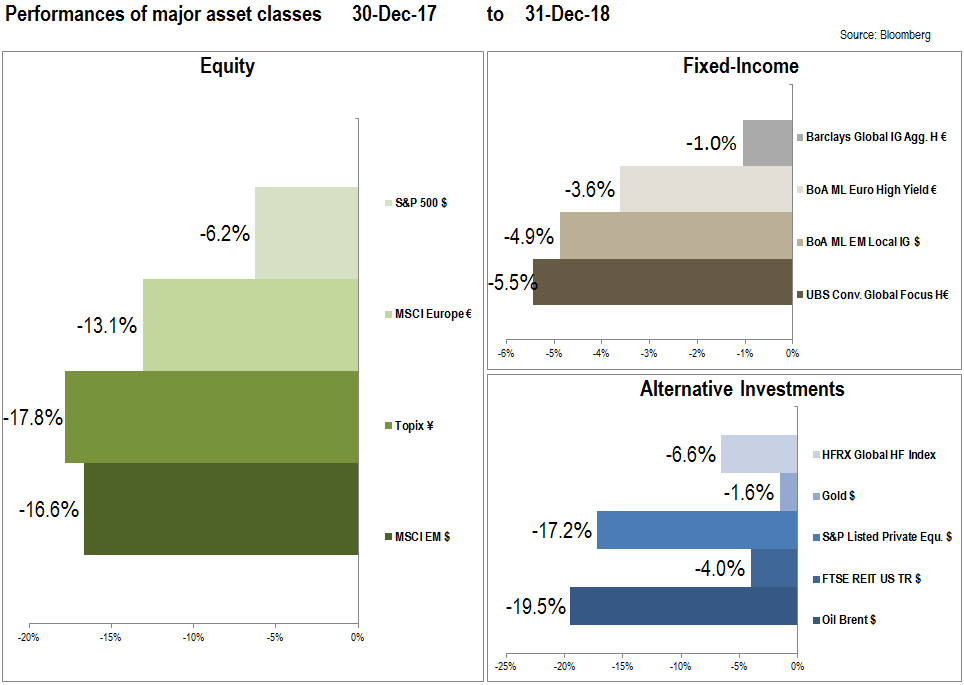
During 2018, all major asset classes delivered negative returns as can be seen above.

EQUITIES

2018: Starting valuations were very demanding. During the year, equity investors were scared by the coming slowdown (some even talk about recession), the US-China trade war, the FED tightening process, the Italian risk, etc.
2019: With valuations already attractive (SP500 PE12Month: 14.6x; MSCI Europe: 12.1x; Topix: 11.3x; EM: 10.6x), we may see the reversal of 2018, as we do not expect a recession but a slowdown in the world economy.

FIXED INCOME

2018: The high valuations at the beginning of the year, the tightening of the FED, the fear to a large economic slowdown, the problems in some emerging markets and the problems of the Italian economy (Italy is one of the largest issuer of bonds in the world) put all the fixed-income indexes in negative territory.
2019: Central banks will continue with the tightening process, so it is still uncertain what government bond bond indexes will do. Credit related assets look more attractive with spreads in the high yield space at around 5.0%, which are interesting with our view of a slowdown, but not a recession.

ALTERNATIVE INVESTMENTS

2018: Alternative investments were not the positive alternative to traditional assets. Hedge Funds and private equity are not able to weather the storm when all the markets are down. Gold did not hedge the portfolios as it does not perform well when rates hike. REITS were also negative in a rate hike environment. Oil was the worst performer with an unbalanced supply-demand, and geopolitics impacting the price in non-predictable ways.
2019: Hedge funds and private equity (more correlated with traditional assets) are likely to revert the losses of 2018. Difficult to predict what gold and REITS will do as monetary tightening is likely to continue. Oil prices have probably reached a bottom level.

CONCLUSION

2018 was the “annus horribilis” of the capital markets with no place to hide to make money. 2019 has started with attractive valuations and some challenges (US-China trade war, Brexit, Central banks tightening). If history is any guide, we may say that after such a bad year, the market delivers good returns the following one. Our view is that we are facing a slowdown in the economy, but markets are incorporating prices that reflect a dramatic slowdown close to a recession.

Chart of the Month – Money for Nothing – and Your Debt (almost) for Free

Money for Nothing – and Your Debt (almost) for Free

Source: Real Investment Advice

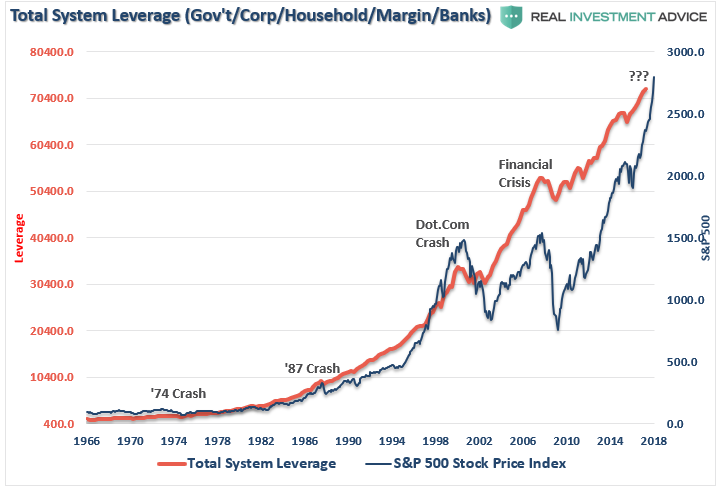
Most of our readers will be old enough to remember the hit single “Money for Nothing” that topped the US charts for three consecutive weeks and won MTV’s video of the year in 1985. Who would have thought that 25 years later one would witness negative interest rates? Following numerous re-iterations of quantitative easing the Fed has provided more than just a life support and fueled the longest uninterrupted bull market in US history which quadrupled the S&P 500 from its intra-day low of 666 on March 9th 2009. Over this period of record low interest rates, US corporates have been able to fund their share-buybacks and in many cases their dividends. More recently this phenomenon has been boosted by a one off tax cut. In addition, the increase in corporate debt has gone hand-in-hand with the increase in profits and cash-flows taking the stock market higher.

Where do we go from here? Inflection points in economic cycles are very difficult to predict and the transition from QE to QT has impacted equity markets of late. The massive sector and factor rotation witnessed in October and the beginning of November have clearly caused a lot of damage to most equity related strategies (long only, long short and market neutral). All this appears to have been sparked off by US monetary policy, setting off a knee jerk reaction in position unwinding by fund managers. With the recent change in Fed rhetoric, one wonders if the Fed has not underestimated the impact of Trump’s trade war. As we all know, leverage always comes back to bite you at some point. The question now is whether to continue to be long the equity market or take a hedged approach as markets are likely to remain volatile.