Chart of the Month – High market dispersion creates alpha opportunities!

High market dispersion creates alpha opportunities!
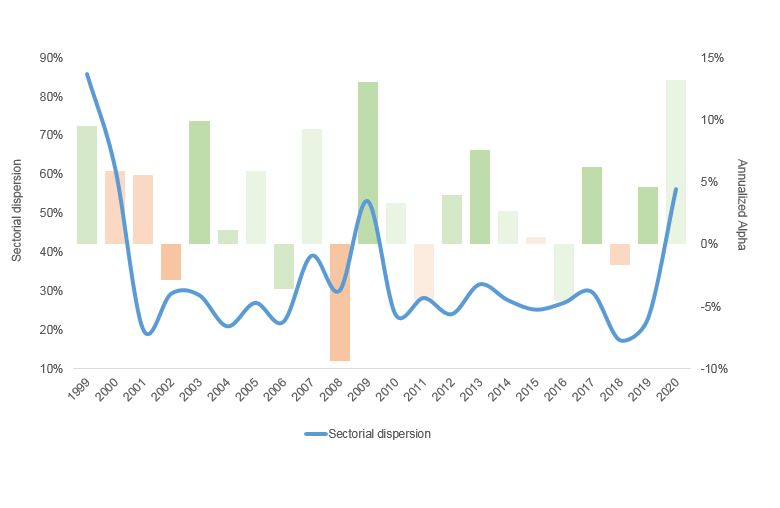
Long / Short Equity Alpha and Market Sectorial Dispersion; Source: Notz Stucki


Due to the Covid-19 pandemic outbreak, 2020 is un-comparable to any other year in financial markets. Authorities in major countries in the World have taken drastic measures to save lives, which have a large negative impact on economic activity. As a response, central banks and Governments have reactivated quantitative easing and started fiscal stimulus in a big way. After having corrected by the same amplitude as in 2008 but in a space of 3-weeks, financial markets literally experienced a V-shape trajectory and are now just back in positive territory if we consider equities and the MSCI World Index. Active managers, and particularly equity long/short managers, have been able to deliver alpha, posting double-digit positive returns.

But let’s take a longer timeframe. If we consider the last 20 years, it is interesting to see the alpha generated by the Haussmann Fund versus the equity market every year and compare it to the MSCI World’s sector dispersion measured by the difference between the performance of the 2 best sectors and the 2 worst sectors. The right axis represents the alpha and if the color of the bars are green it means that market shows a positive return and when it is orange the market shows a negative return. The darker the green bars the more positive the market and vice versa.

The first conclusion is that equity long/short managers are able to generate positive alpha both in down and up markets. The second conclusion, which is more important in a way, is that there is a clear correlation between alpha and sectorial dispersion. This is particularly true when dispersion (with the measure explained above) is above 30% like in 1999 & 2000, 2009 and 2020! We believe that the market environment with high sectorial dispersion, low correlations between stocks within a sector, discrimination between winners and losers and sustained volatility, which gives good entry and exit points, remains favorable for active management in the coming quarters.


Past performance is not indicative of future results. The views, strategies and financial instruments described in this document may not be suitable for all investors. Opinions expressed are current opinions as of date(s) appearing in this material only.

References to market or composite indices, benchmarks or other measures of relative market performance over a specified period of time are provided for your information only. Notz, Stucki provides no warranty and makes no representation of any kind whatsoever regarding the accuracy and completeness of any data, including financial market data, quotes, research notes or other financial instrument referred to in this document.

This document does not constitute an offer or solicitation to any person in any jurisdiction in which such offer or solicitation is not authorized or to any person to whom it would be unlawful to make such offer or solicitation. Any reference in this document to specific securities and issuers are for illustrative purposes only, and should not be interpreted as recommendations to purchase or sell those securities. References in this document to investment funds that have not been registered with the FINMA cannot be distributed in or from Switzerland except to certain categories of eligible investors. Some of the entities of the Notz Stucki Group or its clients may hold a position in the financial instruments of any issuer discussed herein, or act as advisor to any such issuer.

 Additional information is available on request.

© Notz Stucki Group

Chart of the Month – Bike-to-school

Chart of the month: Bike-to-school

September most often means back-to-school time. This year it takes place in a particular context. Our habits have been disrupted over the last few months, our mobility has been reduced, and there is an awareness of our own well-being and the environment.

Social distancing and lockdowns led people to adapt and seek ways to improve their well-being during this odd period. Doing some sport and exercising, but at home with online courses or the purchase of a connected home bike. Once the lockdowns were over, people were encouraged to use soft mobility and avoid public transportation, and a boom in bicycle sales was observed, a sector that was already demonstrating growth and a rising offering on the e-bike side. This is also leading to an increased awareness of the environment and the impact that we can have on it.

There is one investment theme that we have appreciated for several years, driven by the consumption habits of new generations: the quest for wellness.  We are referring here to physical wellness through physical activities: activewear and equipment companies. Before the Covid-19 crisis, codes had already evolved a bit in sport with the improvement of the technicality of products, accessibility and digital. Today, we are in a connected and social sport. Companies in the sector were obliged to quickly adapt. We were already invested in this thematic and have increased our exposure since March (through three of our funds). We have favored companies that have worked their brand image with new generations using strong messages, proposing simple distribution channels, with a wide exposure to digital and we have avoided fitness centers. Many investors over-weighted technology and healthcare in this crisis, but one sector has strongly rebounded since March: it’s wellness. The graph shows a portfolio we created at the end of December 2019 with our exposures and future candidates in the sector. It holds 6 equally-weighted stocks with a monthly rebalancing. We observe a very strong rebound after being very volatile in March.

But where does the future lie? These companies have certainly benefited from a good momentum, but we are convinced that new habits will partially remain and that sports at home or outdoors, will continue to increase, this being a simple way to escape. These companies were good students and this basket offers today a PEG ratio in line with the MSCI World Index. Mobility is resuming around the world and China plays a big role in the strong growth of the activewear segment: the number of Chinese Marathoners is higher than five years ago, the government has set ambitious goals for the construction of sporting facilities and grants tax reductions for companies engaged in sports activities. In our opinion, the quest for wellness has a bright future ahead and is not just a Covid-19 play.


Past performance is not indicative of future results. The views, strategies and financial instruments described in this document may not be suitable for all investors. Opinions expressed are current opinions as of date(s) appearing in this material only.

References to market or composite indices, benchmarks or other measures of relative market performance over a specified period of time are provided for your information only. Notz, Stucki provides no warranty and makes no representation of any kind whatsoever regarding the accuracy and completeness of any data, including financial market data, quotes, research notes or other financial instrument referred to in this document.

This document does not constitute an offer or solicitation to any person in any jurisdiction in which such offer or solicitation is not authorized or to any person to whom it would be unlawful to make such offer or solicitation. Any reference in this document to specific securities and issuers are for illustrative purposes only, and should not be interpreted as recommendations to purchase or sell those securities. References in this document to investment funds that have not been registered with the FINMA cannot be distributed in or from Switzerland except to certain categories of eligible investors. Some of the entities of the Notz Stucki Group or its clients may hold a position in the financial instruments of any issuer discussed herein, or act as advisor to any such issuer.

 Additional information is available on request.

© Notz Stucki Group
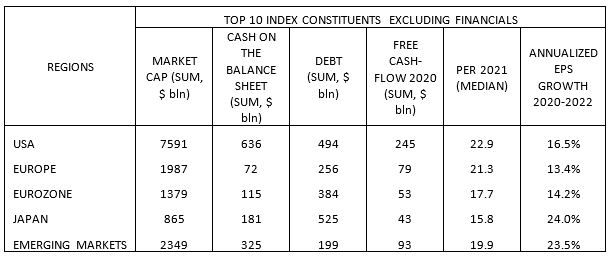
Chart of the Month – Nifty – But not fifty

Chart of the month: Nifty – But not fifty

In this strange and hectic year for markets, giving ammunition to both bulls and bears, eyeballing the top ten constituents of major equity indices gives an indication of what can be expected, and at what cost, for the coming months: in the table below, we highlight different metrics for the US, Europe, the Eurozone, Japan and Emerging Markets.

First of all, what is striking in this table is the size and the quality characteristics of the US market: its largest companies’ market caps exceed the sum of all the others. The cash on their balance sheets and their free cash-flow generation almost match the sum of all the others, and their debt load is by far lower than the sum of all the others. This comes at a price, as their median PER exceeds the others as well.
Another remarkable fact is that Emerging Markets largest companies tend, for the majority of them, to also fall into the “Quality” side of equities, thanks to the IT heavyweights which did not show up some years ago (Alibaba, Tencent, TSMC, JD.com, just to cite a few). Thanks to this, the top constituents of EM share with their US counterparts some interesting features: cash exceeds debt, and just two years of free cash-flow suffice to pay down the entire debt burden. What a contrast with the Eurozone or Japan! And the reason for that is simple: there are still four “Value” or “Cyclical” companies in this top ten in the Eurozone (Total, Siemens, Bayer and Enel), and two in Japan (Toyota and Honda). The lower valuation of these markets seems justified.
And finally, if it is met, the median annualized EPS growth for the next two years looks appealing for all regions. Although it compares favorably for Japan, especially in relation to valuation, this must be relativized by the fact that there are two car manufacturers distorting the numbers here.
With these metrics, large caps equities don’t seem overvalued in general, whatever the region. On top of that, there are probably less risks of missed earnings expectations with the current large weighting in non-cyclical sectors, notably in the US and in Emerging Markets, and an optimistic investor can even hope for a stronger than expected economic rebound that would favor markets like Japan or the Eurozone. The US mega caps seem to be the less prone to bad surprises considering their solid balance sheets and high cash generation, which probably explains their higher valuation. But still, today’s valuations of highly popular stocks in the US are by no means comparable to the nifty fifty bubble, in particular when taking their growth prospects into consideration.
A blended and global approach in terms of stock-picking appears to be the best strategy when it comes to large cap investing going forward, with reasonable probabilities of generating pleasant risk-adjusted returns, especially when compared with other asset classes. Despite all the headwinds, the common wisdom that good things happen to good and well managed companies still prevails.


Past performance is not indicative of future results. The views, strategies and financial instruments described in this document may not be suitable for all investors. Opinions expressed are current opinions as of date(s) appearing in this material only.

References to market or composite indices, benchmarks or other measures of relative market performance over a specified period of time are provided for your information only. Notz, Stucki provides no warranty and makes no representation of any kind whatsoever regarding the accuracy and completeness of any data, including financial market data, quotes, research notes or other financial instrument referred to in this document.

This document does not constitute an offer or solicitation to any person in any jurisdiction in which such offer or solicitation is not authorized or to any person to whom it would be unlawful to make such offer or solicitation. Any reference in this document to specific securities and issuers are for illustrative purposes only, and should not be interpreted as recommendations to purchase or sell those securities. References in this document to investment funds that have not been registered with the FINMA cannot be distributed in or from Switzerland except to certain categories of eligible investors. Some of the entities of the Notz Stucki Group or its clients may hold a position in the financial instruments of any issuer discussed herein, or act as advisor to any such issuer.

 Additional information is available on request.

© Notz Stucki Group
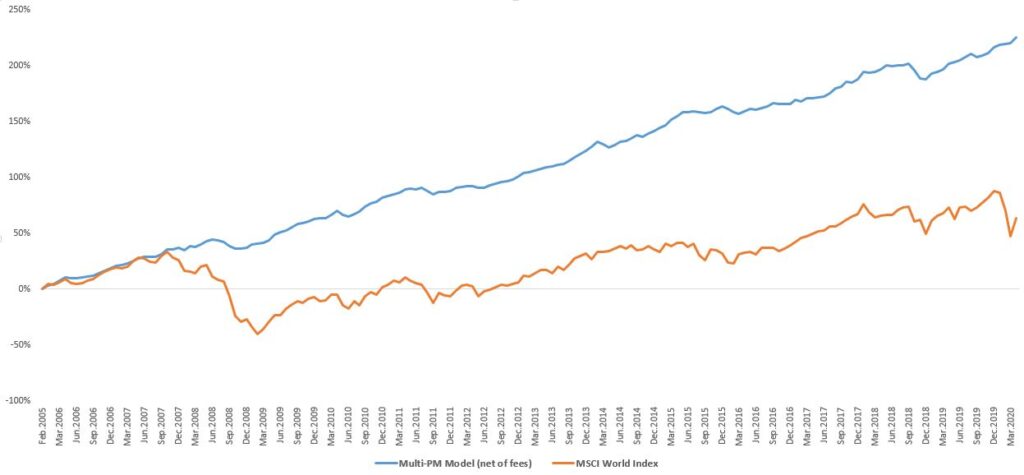
Chart of the Month – Survival of the Fittest: a Darwinian Approach to Hedge Funds

Survival of the Fittest: a Darwinian Approach to Hedge Funds

Source: Notz Stucki

If there ever was to be a defining moment for hedge funds in recent history, this was it! The month of March witnessed mass destruction across global markets as almost all hedge fund strategies, with the exception of tail risk hedging and market neutral equity long short, seemed to have failed miserably under the stress of an unprecedented black swan event. This provided another opportunity for the press to bash on the dismal performance of hedge funds. The reality is that some of the biggest names in the industry failed to protect capital during the market meltdown and missed the rebound. The privilege of being part of the largest and most renowned multi-billion dollar hedge funds with minimum entry tickets of up to USD 50 mio. has faded over the last few years and the latest events may be the final nail in the coffin (we shall refrain from mentioning any names).

So what has survived in this recent turmoil? One can observe that the most successful hedge funds that have stood the test of time are the multi-PM models that have been around since the 1990s for the most successful ones and have been closed to new investors for some time and for which investors crave for a piece of the action. Based on the “eat what you kill” approach, each PM is given an allocation within their core competence to manage with a market neutral approach and a tight stop loss, which if breached, terminates their career at the firm almost instantly. As the risk is diversified across multiple PMs each with a limited pool of capital together with the diversification across multiple asset classes and strategies, the result is a stable stream of returns with very limited drawdowns in times of stress. One of the most successful models in this category is Millennium with an annualized rate of return of 13.65% since 1990. It should be of no surprise that this type of product is in high demand from investors however it has been hard closed to new investments for the last five years (until recently, if you agree to be locked up for eternity – almost!). These type of models have limited capacity and are not scalable, however there have been an increasing number of platforms trying to replicate the Millennium model on a smaller scale. That’s where it become interesting, as in order to maintain a high Sharpe ratio, size is the limiting factor. A back of the envelope exercise of combining existing 11 multi-PM platforms each with a proven track record into one portfolio, equally weighted and rebalanced every month, would result in the historical track record illustrated above (ARR of 8.57% net of fees with a Sharpe above 2). So unless you think you are good at timing the market with ETFs in this current TINA* market environment, why not play safe with a stable return and low volatility portfolio that will compound over time and let you sleep peacefully at night.

Stay tuned, as we are working on a new project in this direction…


*There Is No Alternative


Past performance is not indicative of future results. The views, strategies and financial instruments described in this document may not be suitable for all investors. Opinions expressed are current opinions as of date(s) appearing in this material only.

References to market or composite indices, benchmarks or other measures of relative market performance over a specified period of time are provided for your information only. Notz, Stucki provides no warranty and makes no representation of any kind whatsoever regarding the accuracy and completeness of any data, including financial market data, quotes, research notes or other financial instrument referred to in this document.

This document does not constitute an offer or solicitation to any person in any jurisdiction in which such offer or solicitation is not authorized or to any person to whom it would be unlawful to make such offer or solicitation. Any reference in this document to specific securities and issuers are for illustrative purposes only, and should not be interpreted as recommendations to purchase or sell those securities. References in this document to investment funds that have not been registered with the FINMA cannot be distributed in or from Switzerland except to certain categories of eligible investors. Some of the entities of the Notz Stucki Group or its clients may hold a position in the financial instruments of any issuer discussed herein, or act as advisor to any such issuer.

 Additional information is available on request.

© Notz Stucki Group
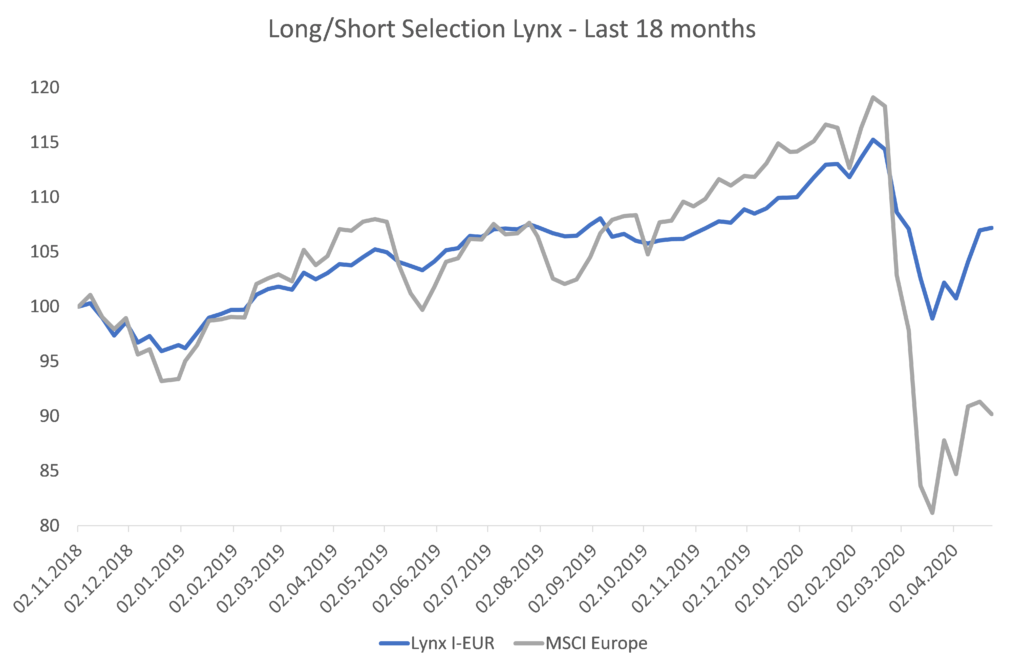
Chart of the Month – Active Management is back!

Active Management is back!

Source: Notz Stucki

During March, the Covid-19 pandemic has forced authorities of a vast majority of countries to implement lockdowns and impose physical distancing measures to contain the spread of the virus. Almost all economic sectors have been literally shut down overnight. This unprecedented situation resulted in some of the most volatile financial markets on record and one of the fastest deleveraging event across all asset classes in history. From the peak of 12 February to the lows of 23 March global equity markets declined approximately 34% showing their worst quarterly performance since 1987.

Contrary to what happened during the financial crisis in 2008, central banks took actions very quickly through massive liquidity injections and governments put huge fiscal stimulus on the table. These measures helped stabilize financial markets but let equity investors with huge uncertainty to navigate markets going forward.

We believe that stock picking, a long/short approach and active exposure management should be favored with a focus on:

  • Countries which are able to manage both the health and economic crises better.
  • Sectors which will not be too much impacted by the economic crisis and become impaired.
  • Companies with high quality earnings and cash flows, strong balance sheets and low debt.

In this difficult environment, Lynx’s strategy to diversify assets across a limited range of independent, absolute return oriented money managers with interests aligned with their investors, worked well as the fund’s NAV declined only -6.9% compared to the equity market which lost -24.3% since the peak in February. This capital protection on the downside is even more remarkable considering that fact that Lynx captured almost 2/3 of the market upside with 40% of the market volatility in 2019. A good way to sleep well while remaining invested in markets?

Chart of the Month – Credit Dislocation

Credit Dislocation

Source: Bloomberg

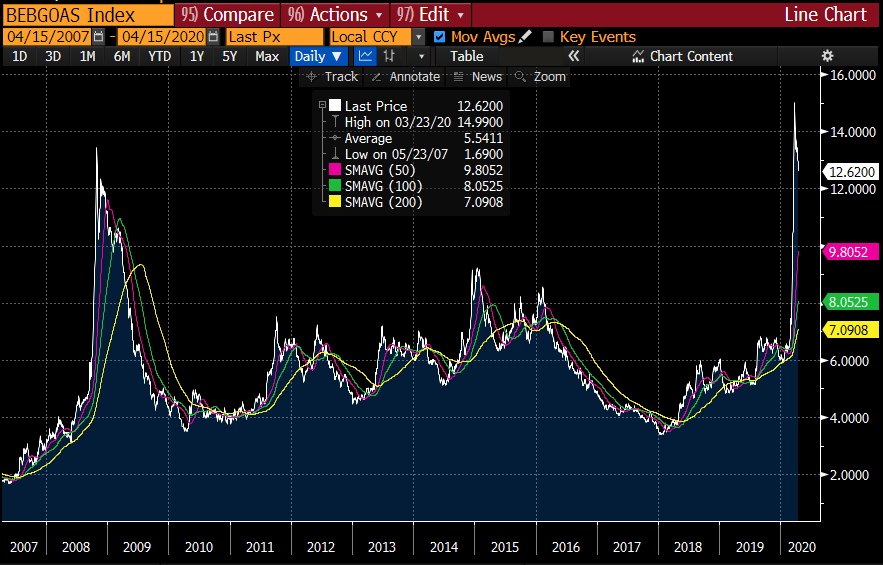
The COVID-19 crisis has translated into one of the biggest financial markets shock in history. The spread in Emerging Market High Yield Debt widened more than during the global financial crisis in 2008. Importantly, this widening happened in a matter of few weeks. This shock is also visible in most asset classes across financial markets. There were essentially two catalysts that explained this crash.

First, the pandemic obliged most countries to suddenly shut down, creating a deep recession without the usual slowdown process which could have allowed to anticipate it. The COVID-19 crisis was also amplified by the price war in Oil, affecting many Emerging markets countries and making the situation even worse. The market suddenly started to price a sharp increase of corporate or sovereign defaults over the coming months.

Second, as market participants realised how deep the problem is, there was a rush to exit risk exposure and de-leverage. However, no one or very few market participants were in a position to absorb this risk, including market makers at global investment banks. Indeed, global investment banks were obliged to deleverage their balance sheets and many global regulations prevent them to be the liquidity provider they use to be. As a result, liquidity disappeared in a matter of days. The Fed decided to intervene massively in order to stabilise markets and regulators are now giving slightly more margin of manoeuvre to banks in order to improve market liquidity.

Dislocations create opportunities but it might be ambitious at this stage to anticipate a V shape recovery without a treatment or a vaccine that allow consumers to resume their pre-crisis way of life.

Chart of the Month – Green? Supergreen!

Chart of the month

Green? Supergreen!

Notz Stucki Research

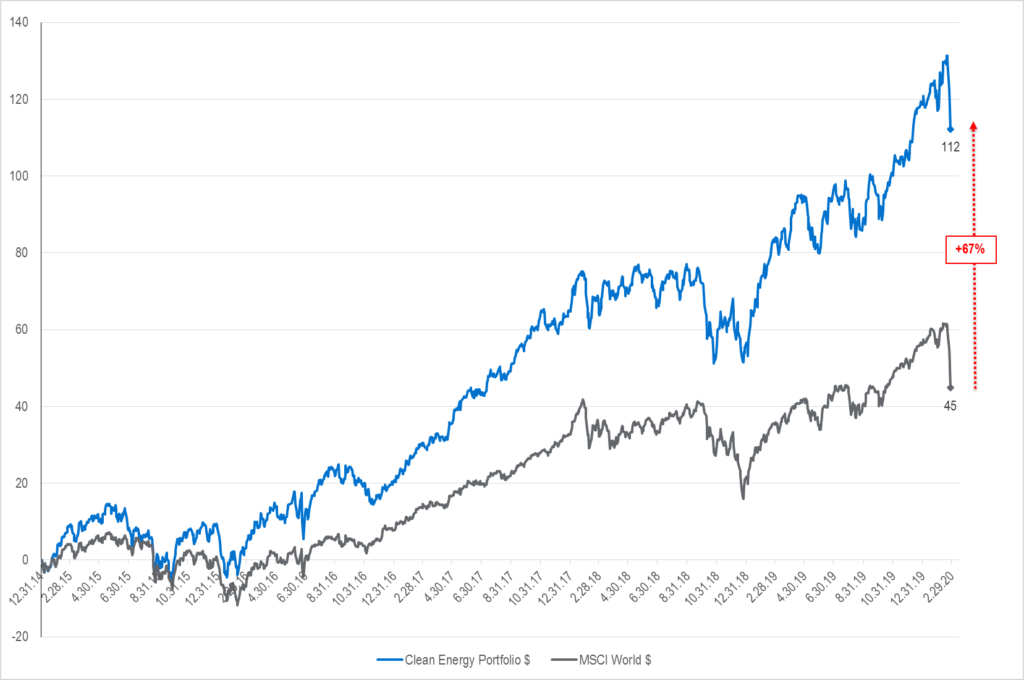
For the past three years, we generally haven’t gone a week without a mention of responsible investment. There is a real awareness of the situation in which we find ourselves, particularly from the point of view of climate change. We have to align our thoughts and our investments: from exclusion of companies to real impact, the range of sustainable investments is wide. Sustainable investments, either directly or through funds or ETFs, are expected to represent between $15 and $20 trillion of all assets under management over the next two to three decades. Since 2016, this approach has grown by 25% in Europe. In all industries, at corporate level, the notion of energy efficiency is increasing; all companies have to cut their carbon emissions. A large number of the world’s biggest companies have improved their energy consumption over the last five years. But there is still a long way to go!

Performance is also a very important factor when deciding to invest in this trend. We are now aware that sustainable investment is not detrimental to returns, and it has been shown that a company’s successful implementation of sustainability enhances its financial performance.

We did the exercise with a Clean Energy portfolio. A global dollar equity portfolio composed of 42 equally-weighted companies in Power, Energy Efficiency and Transport, (automotive, industrial, semiconductors, software, hardware, materials…).  We selected the most popular stocks and excluded extreme points from our analysis. Over the last 5 years, the portfolio’s performance is 112% vs 44% for the MSCI World. We clearly notice an outperformance and an explosion in the portfolio’s performance over the last 3 years.  The performance differential is mainly due to the stock selection and to the theme. The portfolio offers a dividend yield of 1.87% and is trading at 24.1x next year earnings  (PE: 19.1x for the MSCI World) with a correlation of 0.89 to its benchmark. On a YTD basis, the portfolio has demonstrated better resilience than the market.

Where do we stand at Notz Stucki? In Geneva, at corporate level, we launched in December 2017 our philanthropic initiative NS Impact, which supports local and concrete projects involving our employees. In the Asset Management department, we have gradually increased our exposure to sustainable funds in our three asset allocation funds. This ESG-SRI allocation represents between 14.4% and 24.6% of our current exposure, and was built up by investing directly in funds that focus on this specific theme or by switching to sustainable class of the funds we hold if the latter perform better. For our Long Only equity funds, we are in the process of integrating ESG analysis and rating in our stock selection process and are already compliant with the Norges Bank’s exclusion list. From traditional investing to philanthropy, the scope is huge, but taking a few steps in this direction seems to be standard in finance nowadays.

As Korben Dallas asked Ruby Rhod in the 1997 film the 5th element “Green?”, “Supergreen!.”

Cartoon of the Month – “Audentes fortuna iuvat” Fortune sides with him who dares

Cartoon of the Month

“Audentes fortuna iuvat”, Virgil

Currency risk, volatility risk, downside risk, credit risk, liquidity risk, concentration risk, equity risk, key man risk, governance risk, geopolitical risk, duration risk, counterparty risk, disruption risk, opportunity risk, macro risk, regulatory risk, reputational risk, competitive risk …. And the list goes on….

Risk is inherent to investment. There’s nothing like focusing on the list of potential threats to your investment rationale and decisions to prevent you from doing anything and finally make you miss opportunities and, very frequently, pushes you to end up acting in opposition to your principles. Panic buying or panic selling, in general, are done by risk-adverse investors buying at the top and risk-prone investors throwing the towel at the worst time (read: at the bottom).

It is quite common to hear that equities are risky while high grade/Government bonds represent safety. This is true, to a certain extent; it has been true in the past; it will be true again in the future. But not systematically, and in particular today, as safety is more expensive than ever, and in some cases investors are willing to literally pay for safety (German or Swiss Government bonds, among others, are a blatant illustration as they carry negative yields).

Buying safe havens like high quality Government bonds can be good or bad investment decisions on a relative or an absolute basis; still, in the past it has always been a good decision for risk-adverse investors who, at least, got some return from their bullet proof assets and slept well (the counterparty being eventually an opportunity cost compared to riskier assets which would have returned more).

Is this still the case today? Will a price sensitive investor sleep well if interest rates rise and trigger a capital loss on an already negative yielding security with no income? The 0% coupon German 10 year Bund benchmark issued this month at 102.50 will fall by 9% if yields rise from -0.38% to +0.50%; this can’t be qualified as safe and cash deposits at a solid bank would, from our point of view, be a better alternative.

And for those who can bear volatility and have a mid to long term view, equities are certainly the best choice.

As an example to comfort those afraid of a correction, buying the S&P500 at the peak of October 2007 would have generated a 174% total return until today or 8.5% annually, by coincidence very close to the long term return of the US market, and buying the US 20 year Treasury benchmark at the same time would have provided the investor with a still good 98% total return (5.7% annually). But at that time the 20 year was yielding 4.75%. Today it is a meagre 1.6%. Very risky, indeed….

Chart of the Month – 2019: Everything was positive! 2020: Be selective!

2019: Everything was positive! 2020: Be selective!

Source: Bloomberg

One year ago, we stated the following conclusion when we summarized 2018:

“2018 was the “annus horribilis” of the capital markets with no place to hide to make money. 2019 has started with attractive valuations and some challenges (US-China trade war, Brexit, Central banks tightening). If history is any guide, we may say that after such a bad year, the market delivers good returns the following one. Our view is that we are facing a slowdown in the economy, but markets are incorporating prices that reflect a dramatic slowdown close to a recession.”

… and “voilà”, we have had an extraordinary year in all asset classes in 2019, for 3 main reasons:

  1. Many central banks across the world cut rates, injecting liquidity to the capital markets.
  2. The fears to a recession were dissipated and world economies experienced just a slowdown.
  3. US-China trade war already is part of our daily life, and a truce was agreed by the year-end.

EQUITIES

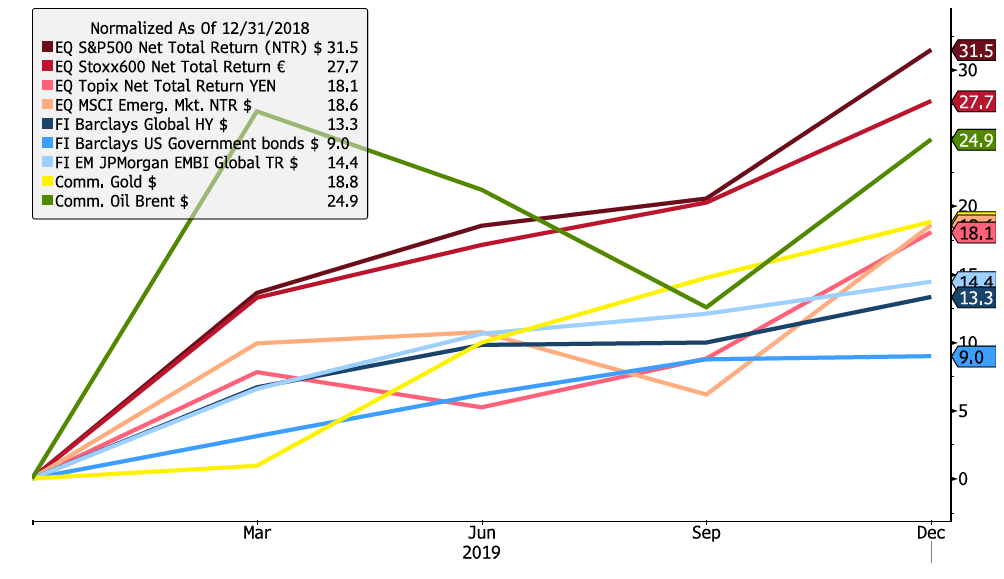
Once again, the US was the leading the market (+31.5%) with the strength of its good information technology companies. Although profits did not grow during 2019, valuations were very attractive at the beginning of the year. The same can be said for the other equity markets.

FIXED INCOME

The planets were aligned for the fixed income market: (1) Central banks cut rates, so Government bonds performed well; (2) the world economy slowed down, but continued with some growth so, corporate spreads compressed during the year in all asset classes; and (3) US-China trade war confrontation decreased and helped emerging markets. In this situation, many fixed-income assets achieved double digit returns in USD.

COMMODITIES

Gold had a remarkable 18.8% performance during the year (is it a safe haven when it appreciated with the rest of the asset classes?) following the more dovish monetary policy of central banks.
Oil had a good performance (Brent went up 24.9%) due to the reasonable oil demand in the world and the controlled supply by the main producers.

ALTERNATIVE INVESTMENTS

Final December performance for hedge funds are not yet available but many hedge funds sub-strategies had double digit returns, especially the equity hedge funds which may have been reached 14% performance for the year.
Private Equity, Private Lending and Real Estate funds had also a good year with massive inflows to these asset classes chasing some yield out of the low yielding returns of fixed-income securities.

CONCLUSION

Will the market mean revert again? After such an excellent 2019, investors may be tempted to believe that 2020 might give up some of these returns. Our “20/20” view is that we must be more selective during 2020, with a moderate positive view:

  • Can we still call the European High Yield market high yield when YTM is only 2.6%? or, is it a low yield market?
  • Investment grade bonds in EUR and CHF are mostly given 0% yield.
  • In the equity market, if profits increase by 5% and dividend yields are at 2%, investors may expect around 7% return for the year.
  • With valuations more demanding, it is key the selection of good managers both on the long-only side and on the hedge fund side. Active management will matter in 2020!

Be careful with the so popular illiquid strategies: Too much money chasing limited opportunities.

Chart of the Month – Luxury: resilience of the 3 musketeers

Luxury: resilience of the 3 musketeers

Marketwise, a year never resembles the previous one. Nevertheless, one element persists: the ability of the major Luxury Goods companies to sail on headwinds, to adapt and resist. Many events have put the market under pressure this year: political and economic episodes, sectoral rotations, trade war, uprising in Hong Kong… Some of these events have had a greater impact on companies in the luxury sector (trade war between the United States and China, riots in Hong Kong, announcement of taxes on imports from the European Union, slowing in China). There is concern about the ability of these companies to overcome this pressure, with the Chinese consumer being the largest consumer in Luxury Goods and Hong Kong being a central attraction for Asian consumers.

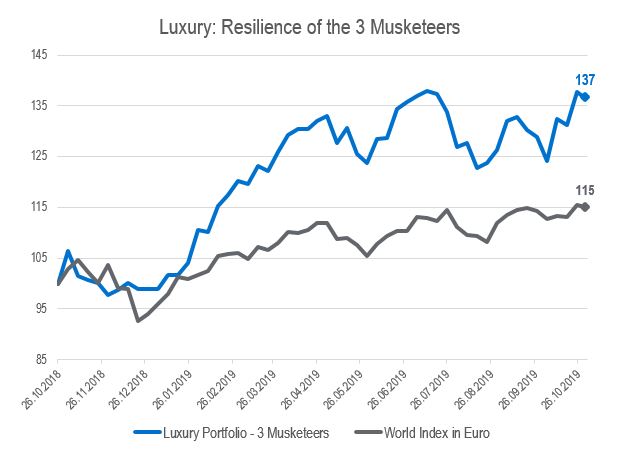
In the last 12 months, a portfolio composed of the equally-weighted three big luxury goods companies outperformed the market significantly, after recovering December’s losses much faster than the latter. These three major luxury goods companies, none other than LVMH, Hermès and Kering, published their third quarter results in October. The observation is the same for all: the three recorded strong sales growth in the third quarter (which includes the riot period in Hong Kong and its escalation). Of course, sales in Hong Kong weakened, but they were completely offset by the other Asian regions, resulting in a strong acceleration of growth in Asia. This region represents between 40% and 50% of the sales of these three companies. These companies have put great efforts into expanding this region of the world, developing e-commerce and opening stores to increase local consumption.

Luxury has a bright future ahead, with a moderate premium today over global equities. We are close to 9% and have already reached much higher levels several times in the recent past (20%). A low premium is generally a good indicator to enter this sector of opportunity.

Stock prices react quickly, these companies keep surprising by their level of margins, their great ability to diversify within their business lines and to adapt to consumer demand. The headwinds will still be very strong in the last quarter of the year but growth is on track! A lesson to learn: these three musketeers still have some nice things to show and it would probably not be a bad idea to buy them at market corrections.