Chart of the Month – From carbon to silicon. The case to invest in semiconductors.

From carbon to silicon. The case to invest in semiconductors.
Source : Bloomberg, IBES, Notz Stucki

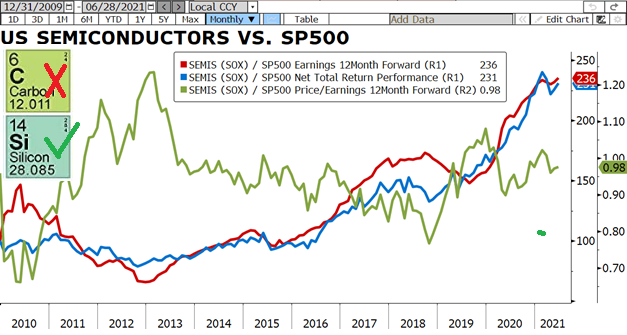
With the climate change, there is a huge trend to decrease the use of fossil fuels, whose main component is carbon. By chance, in the famous periodic table, silicon is just below carbon, and silicon is the main component of the semiconductor chips, which are the foundations of the digital economy. These small chips are the essential technology that makes anything computerised or digital work.

The chart above (blue line) shows the relative performance of the Philadelphia Semiconductor Index (SOX) compared to the performance of the SP500. During the last 11.5 years, this index has outperformed the SP500 by 7.8% per year!!!

What a coincidence that the profits (red line) of semiconductors have also been 7.8% higher per year!!! Once in a while the market seems to be efficient.

Where did the growth come from?

  • Communications (33% of demand), which had a phenomenal growth
  • Computers (29%). Growth has decreased but it is a main component of all computers.
  • Consumer (13%). Consumer electronic products rely on semiconductors
  • Automotive (12%). Cars are increasingly using semiconductors for many functions
  • Industrial (12%). Microcontrollers, power devices, sensors, etc, all need semiconductors

The important question is: Where will the future demand come from?

  • OLD: Communications, computers, consumers, industrials will continue to use more and more chips as the economy continues to “digitalise”.
  • NEW: Electric and Hybrid vehicles need between 3.0 and 3.3 times more chips than a traditional vehicle, and the new economy is going to migrate at an accelerated rate to electric vehicles.
  • NEW: 5G will enable the wide use of the Internet of Things and self-driven cars, which are going to be reliant on chips.
  • NEW: Artificial Intelligence, gaming devices, quantum computers, will all use powerful microprocessors to fulfill their requirements.

With all this use of chips, the demand of semiconductors has outstripped supply to a level such that auto makers cannot deliver enough cars due to chip shortages. Video cards are not fully available either nor video game consoles.

How much do we have to pay to get exposure to semiconductors? the green line in the chart shows the relative PE of semis at 0.98 versus the SP500, more or less in line with the average since 2009. Today, the investor pays the same earnings multiple for semis as he does for the SP500!!!

CONCLUSION

Interesting sector: it grows faster than the market; it is highly exposed to the “digital” economy; it will profit from the migration to electric vehicles; it will profit from the 5G deployment… and all of these without paying a premium!!


Past performance is not indicative of future results. The views, strategies and financial instruments described in this document may not be suitable for all investors. Opinions expressed are current opinions as of date(s) appearing in this material only.

References to market or composite indices, benchmarks or other measures of relative market performance over a specified period of time are provided for your information only. Notz, Stucki provides no warranty and makes no representation of any kind whatsoever regarding the accuracy and completeness of any data, including financial market data, quotes, research notes or other financial instrument referred to in this document.

This document does not constitute an offer or solicitation to any person in any jurisdiction in which such offer or solicitation is not authorized or to any person to whom it would be unlawful to make such offer or solicitation. Any reference in this document to specific securities and issuers are for illustrative purposes only, and should not be interpreted as recommendations to purchase or sell those securities. References in this document to investment funds that have not been registered with the FINMA cannot be distributed in or from Switzerland except to certain categories of eligible investors. Some of the entities of the Notz Stucki Group or its clients may hold a position in the financial instruments of any issuer discussed herein, or act as advisor to any such issuer.

 Additional information is available on request.

© Notz Stucki Group
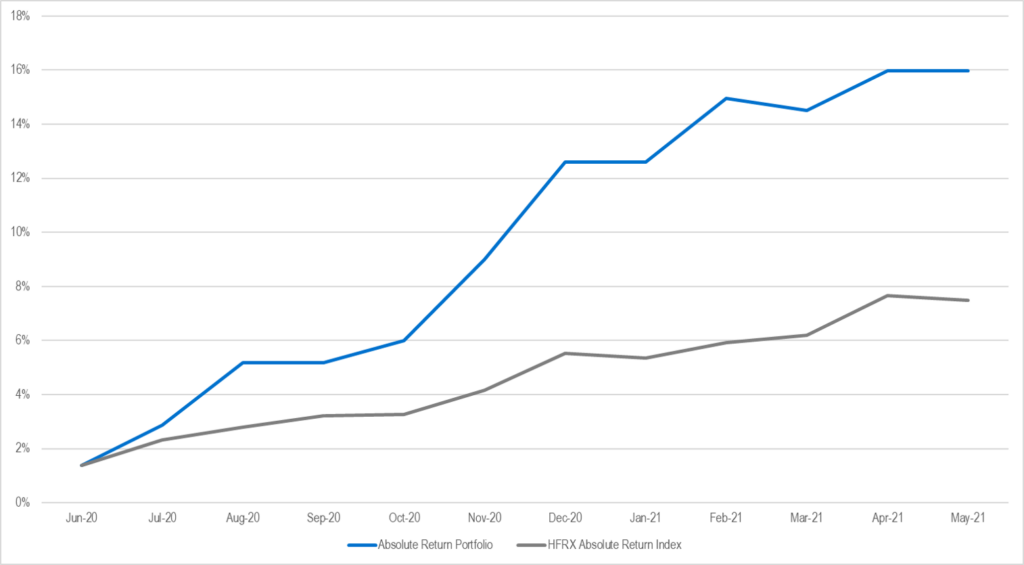
Chart of the Month – In Pursuit Of Looking Sharpe

CHART OF THE MONTH – In Pursuit Of Looking Sharpe

Source: Bloomberg, Notz Stucki

Many readers will remember the golden decade of hedge funds (the 1990s) that ended with the publication of “In Search of Alpha – Investing in Hedge Funds” the first of a series by the infamous Alexander Ineichen of UBS (a training manual for the latest incoming summer intern eager to learn about the mysteries of hedge funds) published a few months before the burst of the dot-com bubble in the year 2000.

Times have evolved since then, as changes in regulation have been a game-changer (Reg FD and the Volcker Rule to name a few). In addition, market participants have evolved due to the influx of institutional capital in the space and market dynamics have evolved as the average holding period of investments have become much shorter (thanks to increasing impact of the quants, artificial intelligence, geo-political events and Robinhood/Reddit platforms). The hedge fund investor base has also changed dramatically as Geneva, once the center of the world for hedge fund managers seeking capital from private banking HNW clients, has been overtaken by the largest pension, endowment and sovereign wealth funds which have taken the lion’s share of the industry.

Fast forward 10 years to the 2010s and you have the “lost decade” of hedge funds (proprietary desks disappeared, QE infinity made shorting very challenging and mutual funds / ETFs were in hindsight the obvious way to play the longest equity bull market in history). Will 2020 mark another golden decade for hedge funds? It certainly started nicely but proving to be less of a walk in the park so far this year!

Our dedicated absolute return mandate was launched 23 years ago using a multi-strategy approach and designed with the objective of generating consistent low volatility returns through periods of rain or shine, however it did face some difficulties during periods of black swan events like many of its peers. The FoF’s historical recipe for success had been in concentrating portfolios with the most talented single strategy managers in which you had the highest conviction. The downside of this approach is that you can become more volatile at times and before you realize one of your managers is down, it’s too late and it will take you a further 3 months to get out at best, or a year if not more (thanks to the infamous gate) together with the right to inherit a side pocket or two that will take 10 years to liquidate.

Twelve months ago, we wrote a piece entitled “Survival of the Fittest, a Darwinian Approach to Hedge Funds” which was to be the catalyst in undertaking a number of changes to significantly enhance the existing portfolio and make it more robust in market drawdowns and hence improve its Sharpe ratio (and Sortino). The result over the last 12 months have been promising as the Sharpe ratio generated has been 3.75 (which will probably never be repeated!) but more importantly the drawdown has been limited to 39 basis points with 4 of the last 6 months witnessing the worst alpha destruction in the equity space since records began. The changes have focused primarily on diversifying the portfolio across strategies, some of them being more niche and less scalable (therefore less accessible to pension funds/endowments) and having a risk management process based on the idea of the “electrified fence” whereby managers who reach their maximum drawdown limit will have their exposure taken down to zero and it’s “game over”. Add first loss capital arrangements and you take the concept of capital protection to the next level. Hence the multi-PM approach we described in our last piece which will enable us to limit drawdowns and compound returns over time increasingly outperforming the benchmark index over time. Our Multi-strategy and Equity Arbitrage allocations are complemented by what we consider some of the best managers in Credit Arbitrage and Discretionary Macro with a proprietary trading mentality in order to create a four-cylinder vehicle (ESG oblige). Most of our readers may have noticed the impressive comeback in discretionary macro managers in the last two years (a strategy Notz Stucki has been involved in over 50 years of investing in hedge funds and part of its DNA).

With the moves in the bond market together with the equity market’s shifts from growth to value as unpredictable as European weather of late, we hope to prove that our all-weather approach will have a better future as market volatility is here to stay. Let’s face it, what other alternative to fixed income do you have today?

Allow me to end this piece with a quote from Charles Darwin: “It is not the strongest of the species that survives, nor the most intelligent that survives. It is the one that is the most adaptable to change.”


Past performance is not indicative of future results. The views, strategies and financial instruments described in this document may not be suitable for all investors. Opinions expressed are current opinions as of date(s) appearing in this material only.

References to market or composite indices, benchmarks or other measures of relative market performance over a specified period of time are provided for your information only. Notz, Stucki provides no warranty and makes no representation of any kind whatsoever regarding the accuracy and completeness of any data, including financial market data, quotes, research notes or other financial instrument referred to in this document.

This document does not constitute an offer or solicitation to any person in any jurisdiction in which such offer or solicitation is not authorized or to any person to whom it would be unlawful to make such offer or solicitation. Any reference in this document to specific securities and issuers are for illustrative purposes only, and should not be interpreted as recommendations to purchase or sell those securities. References in this document to investment funds that have not been registered with the FINMA cannot be distributed in or from Switzerland except to certain categories of eligible investors. Some of the entities of the Notz Stucki Group or its clients may hold a position in the financial instruments of any issuer discussed herein, or act as advisor to any such issuer.

 Additional information is available on request.

© Notz Stucki Group
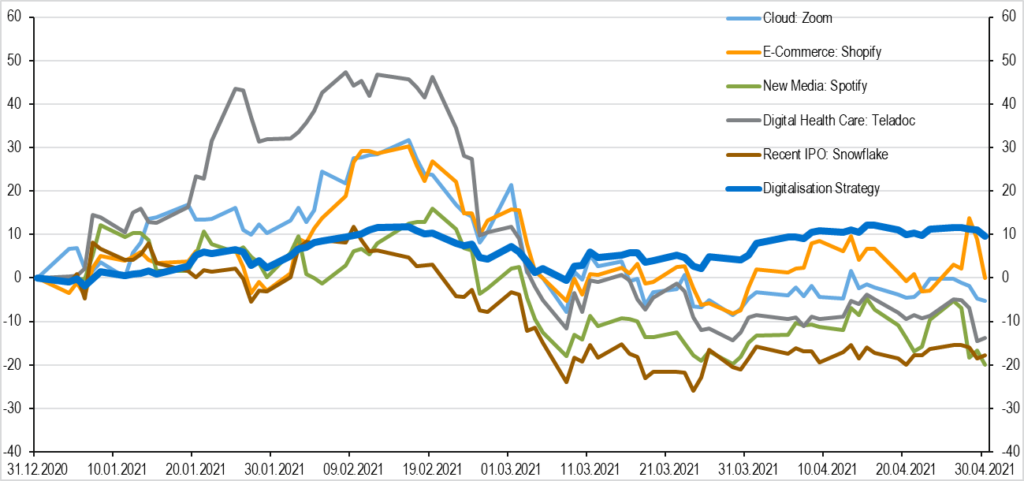
Chart of the Month – Jump on the bandwagon of digitalisation

Jump on the bandwagon of digitalisation

Source: Bloomberg, Notz Stucki

The health crisis has led to the acceleration of an already fast-growing trend: digitalisation. It is already demonstrating its ability to transform the global economy and is now a promising investment.

But what does “digitalisation” mean? In its most basic form, it is probably the elimination of spacial and temporal barriers, there is a performance goal and it is ultimately a logical consequence of technological evolution. More and more objects and processes are improved and transformed to become more efficient through digital technologies. More and more actions can be carried out online. Digitalisation covers a fairly wide range of companies in the market that pertain to information technology, Internet, new media, e-commerce, Internet of Things (IoT), semiconductors, 5G, cloud, among others. And it directly confronts the recent issues of semiconductor shortage, data protection…

The first quarter of 2021 is behind us, the big tech companies have reported extremely good numbers. But how to find your way in this world? Investors are seduced by the new « darling » companies that attract attention. But these are volatile and when it comes to their valuation, it’s enough to make one’s head spin. If you decide to invest in them, you have to be on your toes.

Investment in digitalisation is gaining traction and in April we decided to launch an actively managed certificate on this theme. Our approach is “the stock selection is key” and “don’t give in to temptation “, if you want to invest for medium to long term. Technology-related companies can have very high valuations, and this year it was better to avoid the new « darlings », which were ultimately very volatile, have very high valuations and are negative from the beginning of the year to the end of April.

In our digitalisation strategy, we have no constraints in terms of regions, we cannot do without some of the famous FANG, and we decided to take into account some mid-sized companies with not-so-high valuations, low PEG, revenue growth, interesting ROE level, comfortable cash generation or even growth in the earnings per share. The strategy brings less volatility than a “hot” topic in cloud, e-commerce and new media, with a better performance at the end.

Digitalisation, and especially digital technologies, can accelerate and support development and help every human being. New opportunities will emerge. The digital sector is probably today a major argument and actor in the global reduction of carbon emissions.


Past performance is not indicative of future results. The views, strategies and financial instruments described in this document may not be suitable for all investors. Opinions expressed are current opinions as of date(s) appearing in this material only.

References to market or composite indices, benchmarks or other measures of relative market performance over a specified period of time are provided for your information only. Notz, Stucki provides no warranty and makes no representation of any kind whatsoever regarding the accuracy and completeness of any data, including financial market data, quotes, research notes or other financial instrument referred to in this document.

This document does not constitute an offer or solicitation to any person in any jurisdiction in which such offer or solicitation is not authorized or to any person to whom it would be unlawful to make such offer or solicitation. Any reference in this document to specific securities and issuers are for illustrative purposes only, and should not be interpreted as recommendations to purchase or sell those securities. References in this document to investment funds that have not been registered with the FINMA cannot be distributed in or from Switzerland except to certain categories of eligible investors. Some of the entities of the Notz Stucki Group or its clients may hold a position in the financial instruments of any issuer discussed herein, or act as advisor to any such issuer.

 Additional information is available on request.

© Notz Stucki Group
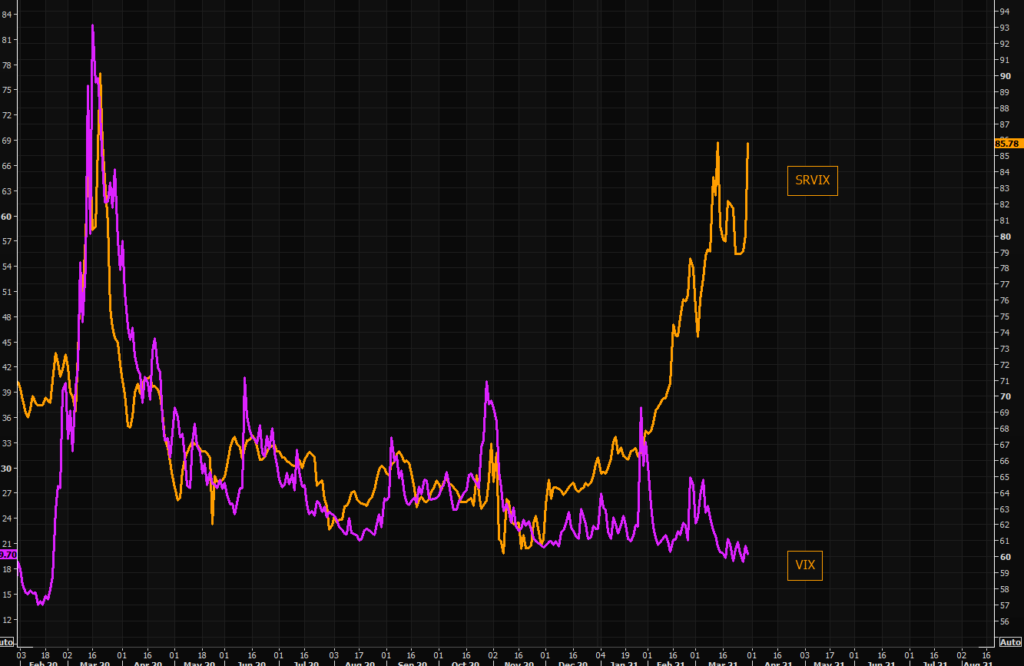
Chart of the Month – Interest Rate vs Equity “Fear”: Two different worlds

Interest Rate vs Equity “Fear”: Two different worlds

Source JP Morgan

SRVIX vs VIX “gap” is once again getting very extreme.

The current gap has been mentioned during multiple conversations with HF managers recently. They also confirmed that equities are not realizing much volatility nor is much “exogenous” risk being priced in for now, as suspicious as it may sound….

The latest turbulence further to the implosion of Archegos is so far just an isolated event, but there is a general trend pushing risk managers to look through the portfolios and the average order book, simulating scenarios in a new way.

Yields have put in a “big shooting star candle”.

Will we get a pause in yields and rates vol?… Most believe that SRVIX vs VIX gap isn’t sustainable.


Past performance is not indicative of future results. The views, strategies and financial instruments described in this document may not be suitable for all investors. Opinions expressed are current opinions as of date(s) appearing in this material only.

References to market or composite indices, benchmarks or other measures of relative market performance over a specified period of time are provided for your information only. Notz, Stucki provides no warranty and makes no representation of any kind whatsoever regarding the accuracy and completeness of any data, including financial market data, quotes, research notes or other financial instrument referred to in this document.

This document does not constitute an offer or solicitation to any person in any jurisdiction in which such offer or solicitation is not authorized or to any person to whom it would be unlawful to make such offer or solicitation. Any reference in this document to specific securities and issuers are for illustrative purposes only, and should not be interpreted as recommendations to purchase or sell those securities. References in this document to investment funds that have not been registered with the FINMA cannot be distributed in or from Switzerland except to certain categories of eligible investors. Some of the entities of the Notz Stucki Group or its clients may hold a position in the financial instruments of any issuer discussed herein, or act as advisor to any such issuer.

 Additional information is available on request.

© Notz Stucki Group
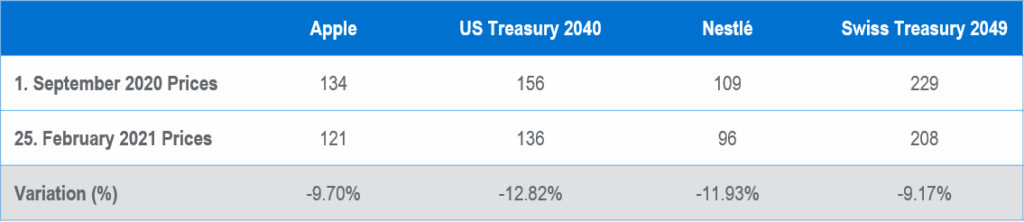
Chart of the Month – The mystery of stock prices falling despite earnings increasing

The mystery of stock prices falling despite earnings increasing

Source: Notz Stucki

“Millions saw the apple fall, but Newton asked why.”
Bernard Baruch

Apple and Nestlé, among many popular large-cap stocks did not perform well since September 2020, despite a rising broad market and favorable earnings releases. Between September 2020 and February 2021, Apple fell close to 10% and Nestlé 12%. Although the most important thing for a stock to perform well over the long term is by far its earnings growth, sometimes, shorter term, this isn’t sufficient to compensate for the other most important factor when it comes to asset prices in general: interest rates. This love and hate relationship between equities and interest rates should, in theory, be very simple to assess: falling interest rates are good for equities as it magnifies future flows, while rising interest rates do the opposite. But this has not been the case all the time; popular “risk-parity” strategies were playing against the maths logic as they were long fixed-income and equities in order to have a protection on possible equity downside thanks to supposedly good returns from bonds when it happens. But this is not what the maths tell you: if the discounting factor (i.e. interest rates) moves higher, then the price of your asset, all else things equal, falls.

And this is precisely what happened during the last 6 months (for some listed companies), as the discounting factor rose quite sharply (US 10 year yield went from 0.7% to 1.47%, 20 year yield from 1.24% to 2.15%). Guess what, maths worked perfectly well this time as long duration equities fell, almost in line with the fall in bond prices like the table above highlights. Apple’s Price Earnings Ratio went from 34 to 27 times 2021 estimated earnings, for Nestlé it moved from 26 times to less than 23. Here’s the proof that although higher yields do not really affect the business of these companies, it definitely has an influence on their valuations. But there are equity sectors which show an inverted correlation compared to what the maths say. First and foremost, financials, the most hatred sector of the last decade. Rising interest rates is good for banks and insurance companies. More broadly, cyclical sectors tend to be shorter duration assets than growth and defensive sectors and logically outperform when yields move to the upside. The very good performance from cyclical sectors since interest rates started to move up was the reason why indices were able to grind higher. This is why a balanced approach in terms of sectors is important. We don’t know if yields will keep on rising, stall or fall; but we do know that building a portfolio of good companies, whatever their sectors, with a nice equilibrium between Value/Growth and Cyclicals/Defensives is the surest way to deliver appreciable returns over the long term.


Past performance is not indicative of future results. The views, strategies and financial instruments described in this document may not be suitable for all investors. Opinions expressed are current opinions as of date(s) appearing in this material only.

References to market or composite indices, benchmarks or other measures of relative market performance over a specified period of time are provided for your information only. Notz, Stucki provides no warranty and makes no representation of any kind whatsoever regarding the accuracy and completeness of any data, including financial market data, quotes, research notes or other financial instrument referred to in this document.

This document does not constitute an offer or solicitation to any person in any jurisdiction in which such offer or solicitation is not authorized or to any person to whom it would be unlawful to make such offer or solicitation. Any reference in this document to specific securities and issuers are for illustrative purposes only, and should not be interpreted as recommendations to purchase or sell those securities. References in this document to investment funds that have not been registered with the FINMA cannot be distributed in or from Switzerland except to certain categories of eligible investors. Some of the entities of the Notz Stucki Group or its clients may hold a position in the financial instruments of any issuer discussed herein, or act as advisor to any such issuer.

 Additional information is available on request.

© Notz Stucki Group

Le graphique du mois – Arguments en faveur de la gestion active en Chine!

Arguments en faveur de la gestion active en Chine!

Source: Notz Stucki

La Chine semble être l’un des grands gagnants de la pandémie de covid-19. En effet, l’économie du pays a enregistré une croissance de près de +3% en 2020 et celle-ci devrait atteindre entre +8% et +9% en 2021. L’appréciation continue du RMB par rapport à l’USD en est une illustration parfaite. Contrairement à ce que l’on observe dans les autres grandes économies mondiales, la politique macroéconomique chinoise devrait, cette année, être équilibrée et se concentrer sur les réformes de la demande avec pour objectif de stimuler la consommation par l’emploi, la sécurité sociale et la répartition des revenus.

Une forte croissance du PIB réel en 2021 et une éventuelle dose de reflation sont susceptibles de dynamiser la rentabilité des entreprises, notamment dans les secteurs de la consommation et de l’industrie. Les bénéfices seront le principal vecteur de performance des actions chinoises et même si leurs valorisations sont assez élevées en termes absolus, elles paraissent raisonnables par rapport à celles des autres marchés mondiaux et notamment celles des actions américaines.

Bien qu’il soit encore sous-représenté dans les indices mondiaux, le marché des actions A chinoises est le deuxième plus grand marché actions au monde et regorge d’opportunités de croissance structurelle. Les principaux champions sont à chercher parmi les leaders industriels, les entreprises qui surfent sur les grandes tendances post-pandémiques et les secteurs qui devraient bénéficier du plan quinquennal en termes de soutien politique et de dynamique des réformes (la Chine entend devenir autonome!) à savoir, la technologie, l’innovation, la numérisation, les nouvelles infrastructures, les investissements verts et la demande intérieure.

La combinaison de ce contexte macroéconomique solide et des réformes du marché financier pourrait entraîner une réallocation importante des flux vers les actions A chinoises. Or, compte tenu des inefficiences plus importantes du marché et de la présence d’un grand nombre d’investisseurs particuliers, les actions chinoises constituent un environnement riche en opportunités d’alpha. Le graphique ci-dessus présente les performances sur trois ans glissants, au cours de la dernière décennie, de l’indice MSCI China, de l’indice EurekaHedge China Equity Long/Short et de notre sélection de gérants d’actions chinoises Long/Short regroupés dans un fonds multi-gérants monde depuis 2015 (la pondération de chacun des gérants a été maintenue au même niveau pour éviter les biais).

Conclusions:

  1. l’investissement en actions chinoises long/short constitue une source d’alpha durable dans le temps
  2. une sélection efficace de gérants talentueux dans cette catégorie apporte une réelle valeur ajoutée

Notre nouveau fonds multi-gérants d’actions chinoises, dont le lancement est prévu fin mars, s’inspirera largement de cette sélection de gérants d’actions long/short et devrait permettre la diversification de portefeuilles classiques d’actions mondiales.


Les performances passées ne garantissent pas les résultats futurs. Les opinions, stratégies et instruments financiers décrits dans le présent document peuvent ne pas convenir à tous les investisseurs. Les opinions énoncées sont celles valables à la date de publication de ce document. Toute référence aux indices de marches ou composites, indices de référence, ou autres mesures de performance relative des marches a une certaine période sont indiquées à titre d’information. Notz Stucki ne donne aucune garantie et n’est aucunement responsable de l’exactitude et de l’exhaustivité de l’ensemble des informations (données financières de marche, cours de bourse, avis de recherche ou description de tout autre instrument financier) contenus dans ce document. Le présent document n’est pas destiné aux personnes ou entités qui seraient citoyennes ou résidentes d’un lieu, état, pays ou juridiction dans lesquels sa distribution, sa publication, sa mise à disposition ou son utilisation seraient contraires aux lois ou règlements en vigueur. Les informations et données fournies dans le présent document sont communiquées à titre indicatif uniquement et ne constituent ni une offre, ni une incitation à acheter, vendre ou souscrire a des titres ou tout autre instrument financier. Il est fait référence dans ce document a des fonds d’investissement qui n’ont pas été enregistrés auprès de la Finma et ne peuvent donc pas être distribues en ou depuis la suisse sauf à certaines catégories d’investisseurs éligibles. Certaines des sociétés du groupe Notz Stucki ou ses clients peuvent être détenteurs d’une position dans les instruments financiers de l’un des émetteurs mentionnes dans ce document, ou agir en tant que consultant pour l’un d’eux. Des informations supplémentaires sont disponibles sur demande.

© Groupe Notz Stucki

Chart of the Month – The case for good active management in China!

The case for good active management in China!

Source: Notz Stucki

One of the big winners of the COVID-19 pandemic appears to be China, which has seen its economy grow by almost +3% in 2020 and is expected to grow between +8% and +9% in 2021. The continued appreciation of the RMB versus the USD is the best evidence of it. Contrary to what is happening in the other world large economies, this year’s Chinese macro policy should be balanced with a focus on demand-side reforms and an objective to boost consumption through employment, social security and income distribution.

Strong real GDP growth in 2021 and the possibility to see some reflation pickup would be beneficial to corporate profitability, particularly in the consumer and industrial sectors. Earnings will be the key driver for equity returns and even if equity valuations are quite high on an absolute basis, they look reasonable compared to global peers and particularly to the US.

The China A-Shares market, which is the 2nd largest equity market globally but still under-represented in global indexes, is the place for structural growth opportunities. Expected winners are to be found among industry leaders, companies surfing on the mega trends of the post-pandemic world and sectors which should benefit from the 5-year plan in terms of policy support and reform push (China wants to become self-dependent!): technology, innovation, digitalization, new infrastructure, green investments and domestic demand.

The combination of this strong macroeconomic backdrop and financial market reforms could bring significant reallocation flows to China A-Shares. With higher market inefficiencies and a high retail investor participation, Chinese equities are a fertile environment for alpha opportunities. The chart above shows the rolling 3-year performance of the MSCI China Index, the EurekaHedge China Equity Long/Short Index and of our selection of China Equity Long/Short managers within a global multi-manager fund since 2015 (each manager is kept at the same weight to avoid biases) over the last decade.

Conclusions:

  1. equity long/short investing in China is a sustainable source of alpha over time.
  2. a good selection of talented manager in this category provides real added value.

With an expected launch date for the end of March, our new China Multi-Manager Fund will be largely inspired by this selection of equity long/short managers and should offer diversification benefits to a typical global equity portfolio.


Past performance is not indicative of future results. The views, strategies and financial instruments described in this document may not be suitable for all investors. Opinions expressed are current opinions as of date(s) appearing in this material only.

References to market or composite indices, benchmarks or other measures of relative market performance over a specified period of time are provided for your information only. Notz, Stucki provides no warranty and makes no representation of any kind whatsoever regarding the accuracy and completeness of any data, including financial market data, quotes, research notes or other financial instrument referred to in this document.

This document does not constitute an offer or solicitation to any person in any jurisdiction in which such offer or solicitation is not authorized or to any person to whom it would be unlawful to make such offer or solicitation. Any reference in this document to specific securities and issuers are for illustrative purposes only, and should not be interpreted as recommendations to purchase or sell those securities. References in this document to investment funds that have not been registered with the FINMA cannot be distributed in or from Switzerland except to certain categories of eligible investors. Some of the entities of the Notz Stucki Group or its clients may hold a position in the financial instruments of any issuer discussed herein, or act as advisor to any such issuer.

 Additional information is available on request.

© Notz Stucki Group
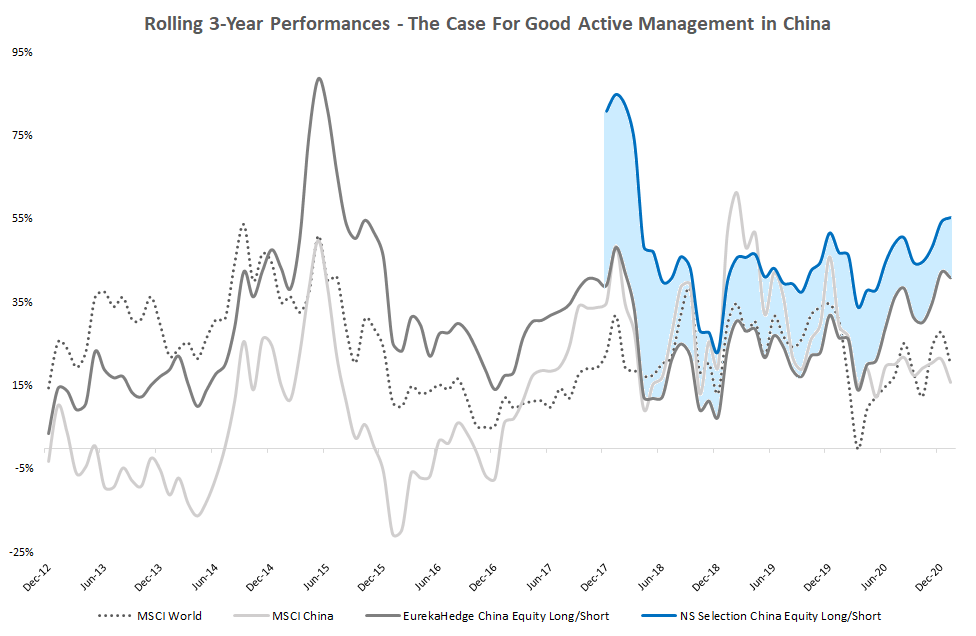
Chart of the Month – Equities: focus on sectors & themes

Equities: focus on sectors & themes

Source: Notz Stucki

In the early days of Notz Stucki, the country was an important factor to cherry pick the best companies for an equity portfolio. Capital markets were more isolated, trade flows were smaller, interest rates differed among countries, and some countries had specific political risks. As a consequence of that, the top-down investment process started with the country view and, after that, sector view and stock picking.

As the economies became more integrated from the trade point of view and from the capital market point of view, the country notion became less important. The birth of the euro for instance, changed the nature of equity investments and many investors started to consider the Eurozone or Europe as one region to invest, and not specific countries.

Time went by and when we look at the market today, we notice that sectors have become the dominant factor to explain performances:

  • US energy companies lost 37.6% in 2020 and European energy companies lost 37.2%.
  • Information Technology in the US gained 44.5% and the Asian IT companies gained 51%.
  • Companies linked to “cleaner energy” have performed very well regardless of their geographical exposure.

Why have sector/themes become a dominant factor rather than countries/regions?

  • Trade flows for goods have increased over the last decades.
  • Flow of services has increased over the last decades.
  • Capital markets are more integrated.
  • Big multinational companies are dominating the market so the domicile of the company may differ from the origin of its revenues. For instance, Roche (Swiss company) has 50% of its sales in the USA, 21% in Asia, and 22% in Europe.
  • The asset management industry has recently focused more and more on investment themes like Digitalisation, Circular economy, Health, Wellness, Water, Artificial Intelligence, Cloud, etc, and those investments are free to select companies from all the regions.

IMPLICATIONS FOR NOTZ STUCKI INVESTMENT PROCESS AND MARKET VIEWS

With this more explicit focus on sectors and themes, we have modified our recommendations accordingly, so we have the following expectations at the beginning of the year:

  • Positive view on Materials and Industrials to play the theme: “Back to normal”. With 3 vaccines already approved for emergency use, we expect the economies to recover by the 2H21, so we have this positive view on these cyclical sectors.
  • Positive view also on Consumer Staples, MedTech and Information Technology. They have attractive PEG ratios versus the world equity index, and they enjoy positive trends for the next decades.
  • We still hold a negative view on Financials, a sector that is negatively affected by low rates and that is being attacked by many new Fintech companies who would like to “eat” the profits of, specially, the banks.
  • We also like the theme of Cleaner Energy, a cross-sector theme that takes companies from Information Technology, Industrials, Utilities and Materials.

After the good rally in equities in 2019 and 2020, the focus on sectors and themes will help investors navigate a challenging period with demanding valuations in many companies.


Past performance is not indicative of future results. The views, strategies and financial instruments described in this document may not be suitable for all investors. Opinions expressed are current opinions as of date(s) appearing in this material only.

References to market or composite indices, benchmarks or other measures of relative market performance over a specified period of time are provided for your information only. Notz, Stucki provides no warranty and makes no representation of any kind whatsoever regarding the accuracy and completeness of any data, including financial market data, quotes, research notes or other financial instrument referred to in this document.

This document does not constitute an offer or solicitation to any person in any jurisdiction in which such offer or solicitation is not authorized or to any person to whom it would be unlawful to make such offer or solicitation. Any reference in this document to specific securities and issuers are for illustrative purposes only, and should not be interpreted as recommendations to purchase or sell those securities. References in this document to investment funds that have not been registered with the FINMA cannot be distributed in or from Switzerland except to certain categories of eligible investors. Some of the entities of the Notz Stucki Group or its clients may hold a position in the financial instruments of any issuer discussed herein, or act as advisor to any such issuer.

 Additional information is available on request.

© Notz Stucki Group
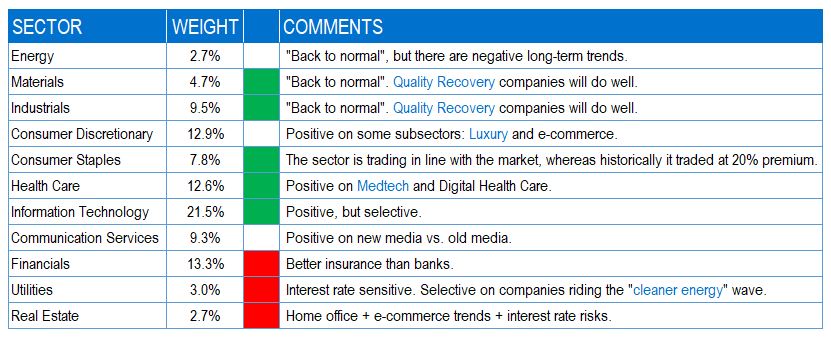
Chart of the Month – Tesla, the best battery company in the world?

Tesla, the best battery company in the world?

Source: Notz Stucki

It’s been almost 12 years since Tesla sold its first street legal all-electric car and 10.5 years since it’s IPO (the second American car company to do so after Ford in 1956!) and what a ride it’s been. Since the start of the year the company’s share price has been defying gravity rising seven-fold to become the largest car company in the world by market capitalization, dwarfing Toyota, VW, Audi, Nio and Daimler combined, and soon will be joining the S&P 500 hall of fame on December 21st as one of the youngest companies. The incredible pace of evolution at Tesla has left most traditional car companies in the dust by banking exclusively on the battery powered vehicle. We all remember the first production hybrid vehicle, the Toyota Prius, which despite its controversial design, managed to dominate its market for two decades before being challenged by its rivals. Fast forward to today and every car company is desperately battling to comply with the EU’s CO2 emission standards (95g/km of CO2) by the end of 2020 or be subject to heavy fines, whilst Tesla finds itself in the sweet spot of being in the lead on the road to net zero carbon. Since its debut, Tesla has been nothing less than disruptive to the transportation world (just like Uber was to the sector). One could argue that it is more of a technology than a car company but clearly it has shifted the goal posts in both sectors to become a cult stock (with an outrageously high PE ratio) or more commonly referred to as a “moonshot” (no pun intended). It has also been the most shorted US-listed stock on the market causing much pain to some of the most highly respected hedge fund managers.

There are numerous acronyms to be found on the web as to what TESLA stands for (besides being the Serbian engineer behind the AC motor), but one which I find most appropriate and reflects their mission statement is The Electric Solar Lifestyle Alternative (energy generation and storage is a smaller but growing part of the business). The backbone of the company’s success has and continues to be its battery technology (which nobody has been able to copy to date). As a child we all had battery powered toys to play with and as adults we continue to rely on battery powered toys (cell phones, laptops, power tools, EVs etc.) and it’s all about battery performance and how long you can last on a single charge. And that’s where Tesla had and continues to have a leading edge. It still leads the competition in terms of mileage on a single charge and will most likely maintain that lead by producing its own batteries for the years ahead. So, what makes Tesla different? Less moving parts (17 drivetrain parts versus 200+ for an internal combustion engine), an enormous amount of torque (enough to make any diehard petrolhead squirm), constant acceleration (no time wasted in shifting gears), permanent four-wheel drive (for safety and traction), affordable and a fast 7-seater family car.

Breaking the 500km/h speed barrier seems to be the nirvana of any hyper-car manufacturer (just recently surpassed by the all-American SSC Tuatara, but yet to be officially recognized) but then again who in their right mind would want to drive at that speed, yet alone find a straight road long enough to achieve that without being arrested or killed by the slightest gush of lateral wind. But try accelerating in a Tesla Model S in “Ludicrous Mode” (the equivalent of a “Launch Control” in modern sport cars) to the next traffic light (0-100 km/h in 2.28 seconds) and you can put to shame the fanciest, exclusive and most expensive of supercars (including any brand powered by a naturally aspirated, turbo-charged, hybrid or all electric motor – and street legal; the list is too long and embarrassing to be included here!). Try a quarter mile race against these cars and you have a different story (even the good old V12 strikes back), but Tesla is working on challenging the best supercars on the infamous and merciless Pike’s Peak Hill Climb (20 km and 156 corners) and the Nürburgring’s Nordschleife track (20.8 km and 76 corners) and the results are not too shabby for its Model S, although the latest iconic limited edition Mercedes-AMG Black Series has just managed to outdo itself on the latter track as the fastest production car in history (it is a two seater carbon-fiber fitted racetrack car and not a seven-seater family sedan), but only by 30 seconds! We are all looking forward to Tesla’s new 4-seater roadster to be released next year which promises to deliver even more outperformance and a range of 1,000 km. If one could add some German engineering (but not too much) and some Italian design (a la Pininfarina) to Tesla’s Model S, you could have the next best Christmas present, as you may not be getting on an airplane anytime soon. Or you can wait until next year for the new Tesla Roadster which will get you from 0-100 km/h in less than 2 seconds!

You know that times are changing at a fast and furious pace when the Hummer, of all cars, goes all electric with its latest Humvee RV. As the old adage goes, the best way to predict the future is to create it…

Drive safely and Merry Christmas!


Past performance is not indicative of future results. The views, strategies and financial instruments described in this document may not be suitable for all investors. Opinions expressed are current opinions as of date(s) appearing in this material only.

References to market or composite indices, benchmarks or other measures of relative market performance over a specified period of time are provided for your information only. Notz, Stucki provides no warranty and makes no representation of any kind whatsoever regarding the accuracy and completeness of any data, including financial market data, quotes, research notes or other financial instrument referred to in this document.

This document does not constitute an offer or solicitation to any person in any jurisdiction in which such offer or solicitation is not authorized or to any person to whom it would be unlawful to make such offer or solicitation. Any reference in this document to specific securities and issuers are for illustrative purposes only, and should not be interpreted as recommendations to purchase or sell those securities. References in this document to investment funds that have not been registered with the FINMA cannot be distributed in or from Switzerland except to certain categories of eligible investors. Some of the entities of the Notz Stucki Group or its clients may hold a position in the financial instruments of any issuer discussed herein, or act as advisor to any such issuer.

 Additional information is available on request.

© Notz Stucki Group
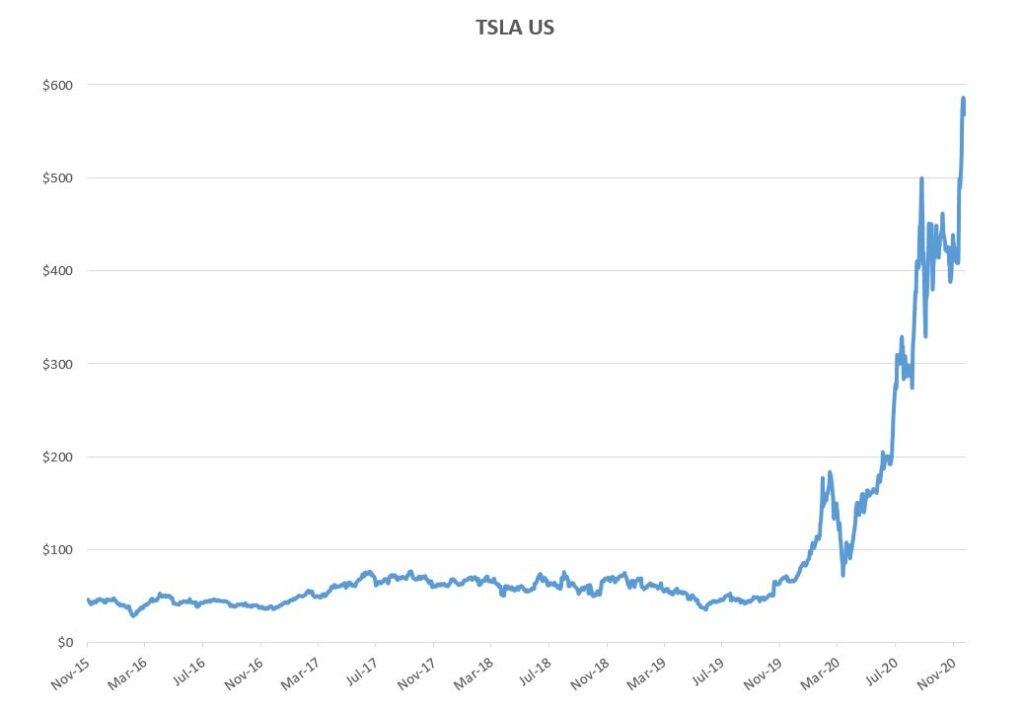
Chart of the Month – «If you ask me anything I don’t know, I’m not going to answer» Yogi Berra

Chart  of the month «If you ask me anything I don’t know, I’m not going to answer» Yogi Berra

Source: Stifel Nicolaus, Notz Stucki

And yes, here we go again with one of Yogi Berra’s insightful quote, which, this time, applies for the fate of the economy. It’s anybody’s guess today to give an indication of where the global economy is headed for the next 12 to 24 months, which should not come as a surprise considering the multiple unknowns ahead of us.

First come, first serve, the Covid crisis seems far from abating and its consequences, although now roughly measurable for its first wave, are as opaque as the horizon on a foggy day on Golden Gate Bridge when it comes to its second wave. The outcome of the US elections will have an influence on the US and the global economy (tax increases, domestic stimulus); how will the European economy get out of the current dire straits in which it is stuck; what happens next with the immense amounts of liquidity and debt generated since the start of the crisis; what are the next steps in the China-US economic war; and the list goes on.

Equity markets seem so far to give hope a chance as they’ve recovered sharply from the March lows, but we know things can revert very fast and, amidst this stock prices recovery, there has been an extreme differentiation between sectors, which means that the global picture isn’t that clear for investors.

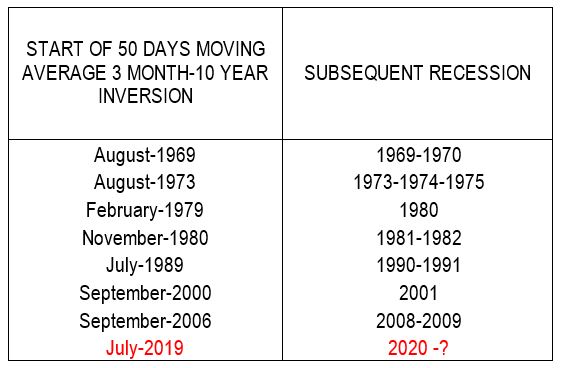
There’s a very silent economist, who very seldom appears, and whose message is almost always accurate: that’s the US yield curve, and in particular the 3 month-10 year steepness.

Does the US yield curve know something we don’t, as it did many times in the past?

There have been 8 recessions in the US since 1969, including the current one. These 8 recessions had been announced in advance as shown on the table above by an inversion of the 50 days moving average of the US 3month-10 years yield differential (i.e. 3 month rates exceeding 10 years rates).

Very few paid attention to 2019’s inversion which happened in a buoyant mood for equity markets and, frankly, no cloud sufficiently big to make anybody contrarian enough to predict a recession in 2020. And this recession happened, for exogeneous factors (COVID-19) which, mid-2019, was totally unpredictable!

Now the good news, if we believe in the predictive power of the yield curve: it reverted into positive steepness in December 2019, and is now at its steepest point since then with a 57 basis points difference.

So if you’re questioned about something you don’t know, say the economy (nobody can predict the economy), you’re not going to answer; but the yield curve will. And today it’s a positive message.


Past performance is not indicative of future results. The views, strategies and financial instruments described in this document may not be suitable for all investors. Opinions expressed are current opinions as of date(s) appearing in this material only.

References to market or composite indices, benchmarks or other measures of relative market performance over a specified period of time are provided for your information only. Notz, Stucki provides no warranty and makes no representation of any kind whatsoever regarding the accuracy and completeness of any data, including financial market data, quotes, research notes or other financial instrument referred to in this document.

This document does not constitute an offer or solicitation to any person in any jurisdiction in which such offer or solicitation is not authorized or to any person to whom it would be unlawful to make such offer or solicitation. Any reference in this document to specific securities and issuers are for illustrative purposes only, and should not be interpreted as recommendations to purchase or sell those securities. References in this document to investment funds that have not been registered with the FINMA cannot be distributed in or from Switzerland except to certain categories of eligible investors. Some of the entities of the Notz Stucki Group or its clients may hold a position in the financial instruments of any issuer discussed herein, or act as advisor to any such issuer.

 Additional information is available on request.

© Notz Stucki Group