
Chart of the Month – The contribution of alternative investments to asset allocation

The contribution of alternative investments to asset allocation

Source: Bloomberg, NS Partners

The debate around inflation is raging these days. While the arguments in favor of temporary inflation clash with those advocating the return of higher structural inflation, it is clear that the narrative of the US central bank has considerably evolved in recent months. To the point that some analysts are now wondering if the Fed simply made a major error of judgment that could lead to serious corrections in financial markets. In the short term the Fed is so “behind the curve” that it has no other choice but to start raising its key rates in March. It is also surprising to see such divergence between DM and EM central banks which already started their rate hike cycle for months. As we are writing these lines, the Fed is still injecting liquidity into markets! However, inflation is mainly a US problem today (with the exception of specific cases such as Turkey and its unorthodox monetary policy, or significant increase in European energy prices) with the combination of several factors: ultra-accommodative monetary policy, unprecedented fiscal stimulus, strong economic growth, excess household savings and record low unemployment rate leading to upward pressure on wages. On top of that, we have the China factor. Indeed, the “zero COVID” policy pursued by the Chinese authorities, coupled with relatively low herd immunity and a less effective vaccine, are causing repeated partial shutdowns of the Chinese economy. The impact on supply chains, particularly for the production of consumer goods for Western countries, is being felt. While headline inflation is quite low in China, inflation on production costs is up more than 10% year-on-year.

This situation will push the central banks of developed countries, and first and foremost the Fed, to raise rates very quickly. The rate and amplitude are difficult to predict, but the direction is clear. There are several consequences in terms of asset allocation and portfolio managers can’t remain insensitive to this change in the macroeconomic environment.

  • Regarding equities, value sectors are now significantly outperforming growth sectors, which had been the big winners of the pandemic and the last decade. Sector exposures will be key in such a macro-driven market environment going forward. With more than 10 rotations in 2021, equity markets have not been so easy to navigate. The performance of the indices can mask certain realities and the Nasdaq, which gained 22% in 2021, would only be up 9% in its 5 largest capitalizations. It seems to us that a “blended” approach with a selection of good quality companies is the right approach at this stage.
  • Regarding bonds, it seems almost impossible to expect a decent return without taking risks for which we are not paid for. The period of free money has lasted so long that certain economic realities will resurface with the end of this era and we don’t see why private debt markets would be immune to the rise in rates.

Over the past 10 years, the classic 60/40 portfolio model, i.e. 60% allocation in equities and 40% in bonds, has generated satisfactory risk-adjusted performance, but we can legitimately doubt that it will be the case for the coming months. In this context, “relative value” strategies seem particularly interesting to consider. Their objective is to deliver consistent performances, decorrelated from markets, with low volatility. There are 2 main relative value strategies:

  1. Multi-strategy multi-PM platforms, which tend to be large by assets and able to attract the best traders in the world and
  2. Smaller managers who implement niche strategies on specific market segments. With an in-depth knowledge of this investment universe, an efficient selection process and capacity to invest with the best managers, NS Partners has been able to build robust portfolios, which have delivered “all weather” returns for more than 20 years.

The chart above shows annual performances of the NS “relative value” strategy compared to the BoA-ML Global Bond and Barclays Global Aggregate 1-5Y bond indices:

  • Over the past 12 years, the strategy has posted a net average annual performance of +5.8%, compared to +3.4% and +2.2% for the two indices.
  • The annualized volatility of the strategy is only 3.1% and shows no correlation with bond markets.
  • Even more interesting, when we consider the 10 months when the US 10-year interest rate increased the most, the strategy posted an average performance of +0.96% while the BoA-ML Global Bond index posted exactly the same average performance in absolute value but with a negative sign, -0.96%!

And if you are not convinced by the past, consider the present. The Bloomberg 60/40 index lost 4.2% in January 2022 whereas the NS RV strategy is estimated to be slightly down for the month.


Past performance is not indicative of future results. The views, strategies and financial instruments described in this document may not be suitable for all investors. Opinions expressed are current opinions as of date(s) appearing in this material only. References to market or composite indices, benchmarks or other measures of relative market performance over a specified period of time are provided for your information only. NS Partners provides no warranty and makes no representation of any kind whatsoever regarding the accuracy and completeness of any data, including financial market data, quotes, research notes or other financial instrument referred to in this document. This document does not constitute an offer or solicitation to any person in any jurisdiction in which such offer or solicitation is not authorized or to any person to whom it would be unlawful to make such offer or solicitation. Any reference in this document to specific securities and issuers are for illustrative purposes only, and should not be interpreted as recommendations to purchase or sell those securities. References in this document to investment funds that have not been registered with the FINMA cannot be distributed in or from Switzerland except to certain categories of eligible investors. Some of the entities of the NS Partners Group or its clients may hold a position in the financial instruments of any issuer discussed herein, or act as advisor to any such issuer.  Additional information is available on request.

© NS Partners Group

Chart of the Month – Shifting gears in the equity markets

Shifting gears in the equity markets

Source: Bloomberg, IBES, NS Partners

The two main drivers of equity markets are liquidity (provided by the Central Banks) and earnings (provided by corporations). When both drivers are favourable, equity performance is extremely good. In the graph above you can see two very good periods reflecting this:

  • (ORANGE): Earnings recovered very fast after the Global Financial Crisis of 2008 and also after the initial stages of the Covid pandemic.
  • (BLACK): FED rates tumbled to almost 0% after the Global Financial Crisis of 2008 and again during the Covid pandemic.
  • (BLUE). The SP500 performed extremely well when the two tail winds blew in the same direction: 16.5% CAGR during the 2009-13 period, and 30% CAGR since April 2020.

But the party cannot last forever, and Central Banks will start tightening and withdrawing liquidity once the economy recovers. The graph shows this situation during the period of Jun13 to Dec18 when the FED started tapering, and then hiking rates. This was an earnings driven market where profits continued to increase while liquidity was reduced by Central Banks. Still the equity market managed to achieve a respectable 9% CAGR performance.

Where are we now? Thanks to the combined efforts of the scientific world (vaccines), Central Banks (rate cuts + bond purchases) and Governments (huge fiscal packages) the world economy has recovered well, so the economy no longer needs assistance from Central Banks. They have either started to reduce liquidity (Bank of England, Norway…), or will do so during 2022 (FED, ECB, …)


WHAT CAN WE EXPECT FOR 2022?

  • (BLACK): The FED will gradually stop buying bonds by April 2022; during 2022 the FED rates will likely increase 3 times, by 0.25% each time. This will be a headwind for the market. Remember the old saying: “Don’t fight the FED”.
  • (ORANGE): Earnings have recovered very fast in 2021 and will continue to increase in 2022 and 2023, but at a lower rate of 10% according to IBES estimates, which is much less than the 25% increase that we enjoyed in 2021.
  • (BLUE). The SP500 will likely rise again in 2022 but with the headwinds from the Central Banks and the lower EPS growth, the market will probably shift down a gear to deliver a return of 5% to 10% performance during 2022.


Past performance is not indicative of future results. The views, strategies and financial instruments described in this document may not be suitable for all investors. Opinions expressed are current opinions as of date(s) appearing in this material only.

References to market or composite indices, benchmarks or other measures of relative market performance over a specified period of time are provided for your information only. NS Partners provides no warranty and makes no representation of any kind whatsoever regarding the accuracy and completeness of any data, including financial market data, quotes, research notes or other financial instrument referred to in this document.

This document does not constitute an offer or solicitation to any person in any jurisdiction in which such offer or solicitation is not authorized or to any person to whom it would be unlawful to make such offer or solicitation. Any reference in this document to specific securities and issuers are for illustrative purposes only, and should not be interpreted as recommendations to purchase or sell those securities. References in this document to investment funds that have not been registered with the FINMA cannot be distributed in or from Switzerland except to certain categories of eligible investors. Some of the entities of the NS Partners Group or its clients may hold a position in the financial instruments of any issuer discussed herein, or act as advisor to any such issuer.

 Additional information is available on request.

© NS Partners Group
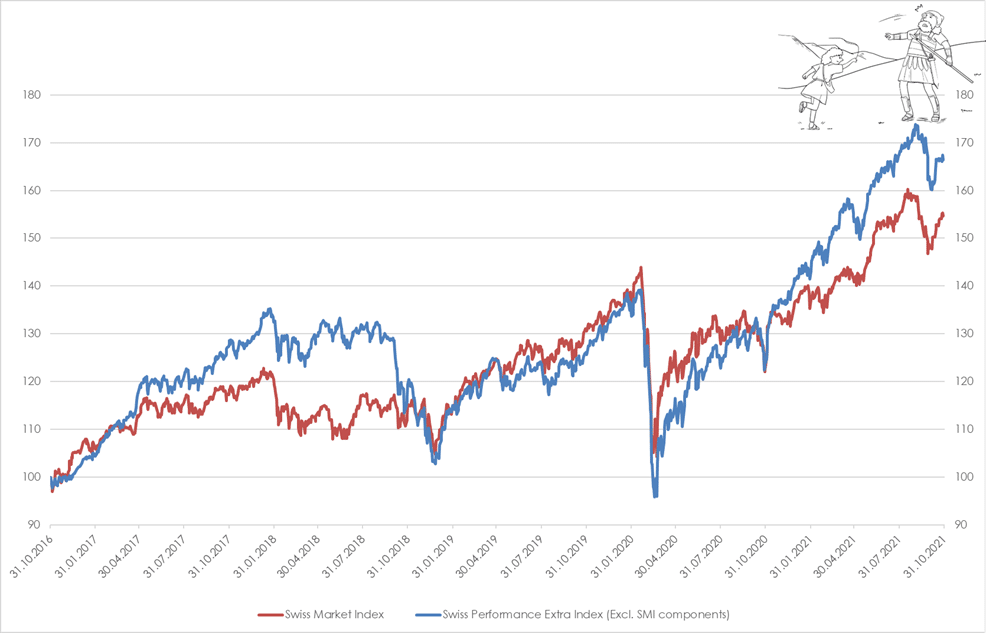
Chart of the Month – Shifting gears in the equity markets

Shifting gears in the equity markets

Source: Bloomberg, IBES, NS Partners

The two main drivers of equity markets are liquidity (provided by the Central Banks) and earnings (provided by corporations). When both drivers are favourable, equity performance is extremely good. In the graph above you can see two very good periods reflecting this:

  • (ORANGE): Earnings recovered very fast after the Great Recession of 2008 and also after the initial stages of the Covid pandemic.
  • (BLACK): FED rates tumbled to almost 0% after the Great Recession of 2008 and again during the Covid pandemic.
  • (BLUE). The SP500 performed extremely well when the two tail winds blew in the same direction: 16.5% CAGR during the 2009-13 period, and 30% CAGR since April 2020.

But the party cannot last forever, and Central Banks will start tightening and withdrawing liquidity once the economy recovers. The graph shows this situation during the period of Jun13 to Dec18 when the FED started tapering, and then hiking rates. This was an earnings driven market where profits continued to increase while liquidity was reduced by Central anks. Still the equity market managed to achieve a respectable 9% CAGR performance.

Where are we now? Thanks to the combined efforts of the scientific world (vaccines), Central Banks (rate cuts + bond purchases) and Governments (huge fiscal packages) the world economy has recovered well, so the economy no longer needs assistance from Central Banks. They have either started to reduce liquidity (Bank of England, Norway…), or will do so during 2022 (FED, ECB, …)


WHAT CAN WE EXPECT FOR 2022?

  • (BLACK): The FED will gradually stop buying bonds by April 2022; during 2022 the FED rates will likely increase 3 times, by 0.25% each time. This will be a headwind for the market. Remember the old saying: “Don’t fight the FED”.
  • (ORANGE): Earnings have recovered very fast in 2021 and will continue to increase in 2022 and 2023, but at a lower rate of 10% according to IBES estimates, which is much less than the 25% increase that we enjoyed in 2021.
  • (BLUE). The SP500 will likely rise again in 2022 but with the headwinds from the Central Banks and the lower EPS growth, the market will probably shift down a gear to deliver a return of 5% to 10% performance during 2022.


Past performance is not indicative of future results. The views, strategies and financial instruments described in this document may not be suitable for all investors. Opinions expressed are current opinions as of date(s) appearing in this material only.

References to market or composite indices, benchmarks or other measures of relative market performance over a specified period of time are provided for your information only. NS Partners provides no warranty and makes no representation of any kind whatsoever regarding the accuracy and completeness of any data, including financial market data, quotes, research notes or other financial instrument referred to in this document.

This document does not constitute an offer or solicitation to any person in any jurisdiction in which such offer or solicitation is not authorized or to any person to whom it would be unlawful to make such offer or solicitation. Any reference in this document to specific securities and issuers are for illustrative purposes only, and should not be interpreted as recommendations to purchase or sell those securities. References in this document to investment funds that have not been registered with the FINMA cannot be distributed in or from Switzerland except to certain categories of eligible investors. Some of the entities of the NS Partners Group or its clients may hold a position in the financial instruments of any issuer discussed herein, or act as advisor to any such issuer.

 Additional information is available on request.

© NS Partners Group
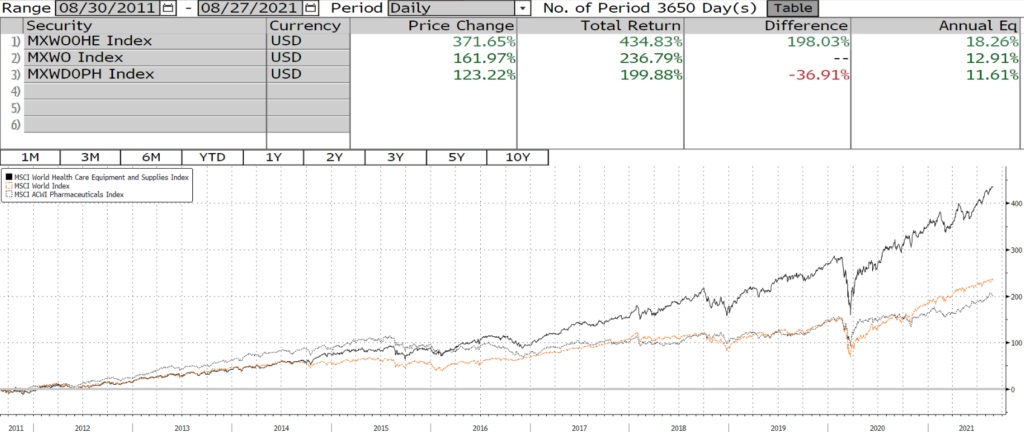
Chart of the Month – Shifting gears in the equity markets

Shifting gears in the equity markets

Source: Bloomberg, IBES, NS Partners

The two main drivers of equity markets are liquidity (provided by the Central Banks) and earnings (provided by corporations). When both drivers are favourable, equity performance is extremely good. In the graph above you can see two very good periods reflecting this:

  • (ORANGE): Earnings recovered very fast after the Great Recession of 2008 and also after the initial stages of the Covid pandemic.
  • (BLACK): FED rates tumbled to almost 0% after the Great Recession of 2008 and again during the Covid pandemic.
  • (BLUE). The SP500 performed extremely well when the two tail winds blew in the same direction: 16.5% CAGR during the 2009-13 period, and 30% CAGR since April 2020.

But the party cannot last forever, and Central Banks will start tightening and withdrawing liquidity once the economy recovers. The graph shows this situation during the period of Jun13 to Dec18 when the FED started tapering, and then hiking rates. This was an earnings driven market where profits continued to increase while liquidity was reduced by Central anks. Still the equity market managed to achieve a respectable 9% CAGR performance.

Where are we now? Thanks to the combined efforts of the scientific world (vaccines), Central Banks (rate cuts + bond purchases) and Governments (huge fiscal packages) the world economy has recovered well, so the economy no longer needs assistance from Central Banks. They have either started to reduce liquidity (Bank of England, Norway…), or will do so during 2022 (FED, ECB, …)


WHAT CAN WE EXPECT FOR 2022?

  • (BLACK): The FED will gradually stop buying bonds by April 2022; during 2022 the FED rates will likely increase 3 times, by 0.25% each time. This will be a headwind for the market. Remember the old saying: “Don’t fight the FED”.
  • (ORANGE): Earnings have recovered very fast in 2021 and will continue to increase in 2022 and 2023, but at a lower rate of 10% according to IBES estimates, which is much less than the 25% increase that we enjoyed in 2021.
  • (BLUE). The SP500 will likely rise again in 2022 but with the headwinds from the Central Banks and the lower EPS growth, the market will probably shift down a gear to deliver a return of 5% to 10% performance during 2022.


Past performance is not indicative of future results. The views, strategies and financial instruments described in this document may not be suitable for all investors. Opinions expressed are current opinions as of date(s) appearing in this material only.

References to market or composite indices, benchmarks or other measures of relative market performance over a specified period of time are provided for your information only. NS Partners provides no warranty and makes no representation of any kind whatsoever regarding the accuracy and completeness of any data, including financial market data, quotes, research notes or other financial instrument referred to in this document.

This document does not constitute an offer or solicitation to any person in any jurisdiction in which such offer or solicitation is not authorized or to any person to whom it would be unlawful to make such offer or solicitation. Any reference in this document to specific securities and issuers are for illustrative purposes only, and should not be interpreted as recommendations to purchase or sell those securities. References in this document to investment funds that have not been registered with the FINMA cannot be distributed in or from Switzerland except to certain categories of eligible investors. Some of the entities of the NS Partners Group or its clients may hold a position in the financial instruments of any issuer discussed herein, or act as advisor to any such issuer.

 Additional information is available on request.

© NS Partners Group
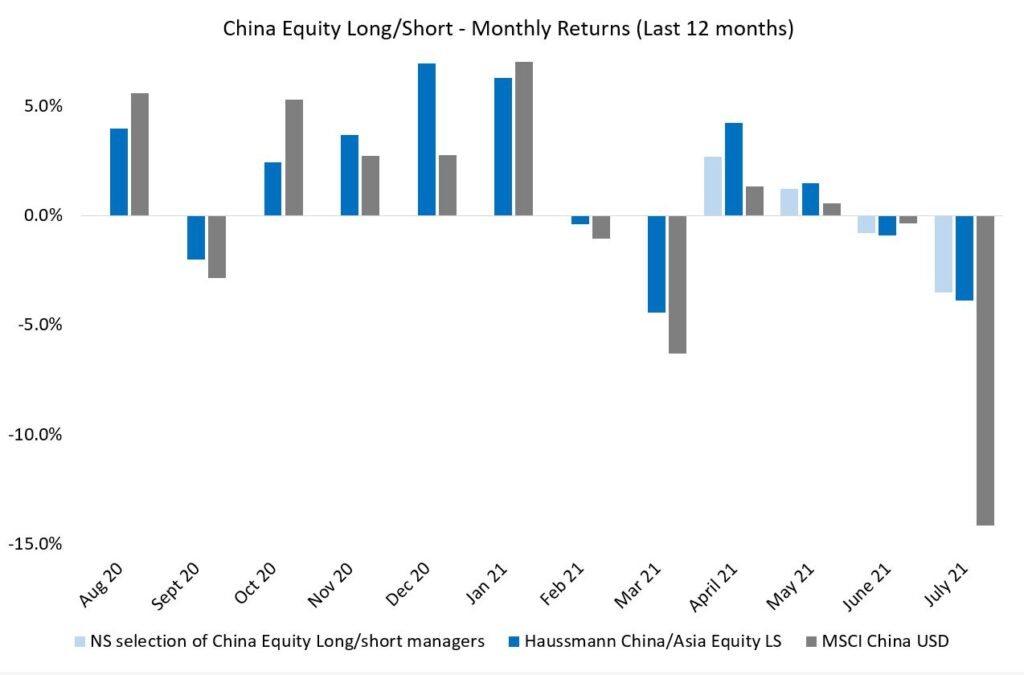
Chart of the Month – Spacaphobia

Spacaphobia


Just as we thought that everyone was SPACked out by now and that the frenzy was over following the first quarter of this year when most SPACs began trading underwater Trump Media & Technology (founded by Mr. Donald Trump in February 2021) merged with Digital World Acquisition Corp. to become the latest meme stock going galactic and gaining 1,657% above its first day close. And until very recently was still the world’s best performing SPAC overtaking Iridium, Lucid Motors, DraftKings and QuantumScape (backed by VW and Bill Gates) to name a few you may have heard of! All you need is to be rich, smart or a celebrity to launch your own SPAC these days. YTD there have been 566 SPACs launched so far (equating to 63% of the capital raised in IPOs this year) and 552 are still searching for a target. More importantly, the amount of capital raised so far this year in SPAC issuance has surpassed the amount raised during the previous 18 years!

As a reminder, a SPAC is a blank-check company, a concept that has been around for the last 25 years but become more popular since last year, COVID oblige. Interestingly, the top five underwriters of SPACs over the last 5 years (a very lucrative business to which you can add leverage a la Archegos given the unlikelihood of losing money) have been Credit Suisse (No. 1 in the last 7 years until this year!), Citigroup, Goldman Sachs, Cantor Fitzgerald and Deutsche Bank. The success of the SPAC market is based on the fact that you can effectively buy a lottery ticket with a money-back guarantee in case you are not satisfied with the purchase (as long as you participate in the initial offering or buy it at or below par on the public market) – the flip side of the “risk-free” ticket is that you may have to wait up to 2 years to get your money back from an interest-bearing trust account if no deal is struck before the expiry date. And if the SPAC does end up finding a perfect match made in heaven with an entity that has no meaningful revenues, you are buying a dream or a moonshot that has a chance of ending very badly.

No surprise that the usual suspects of the hedge fund industry have been the first port of call for SPAC IPOs given the significant assets they manage and their ability to participate in PIPEs in addition to the warrants issued at par that can be traded after 2 months. The net result was that these hedge funds were able to significantly spice up their returns in 2020 with additional percentage points of performance. Despite a less glorious year for SPACs, there are many funds still specializing in the space and most are still performing very well YTD. Many of the multi-strategy hedge funds that historically shied away from the space saw an opportunity in the second quarter as many SPACs traded below their issue price creating a pull-to-par trade on a levered basis that has proved to be very profitable. At the end of September alone, 97% of SPACs outstanding were trading below par.

What many investors fail to realize is that PIPEs (Private Investment in Public Equity) are the most important part of the puzzle as the sponsors need to raise 2-3 times more money than what they get in the SPAC IPO for an acquisition to be viable. In come the hedge fund platforms (again) that can get a sneak preview and negotiate a better deal spiced up with the likes of preferred equity. The SPAC model is once again undermined if the PIPE financing fails to materialize potentially causing the share price to collapse.

Sky’s the limit when one gets into IPOs within the electric automotive industry’s Tesla wannabe’s (Amazon-backed Rivian Automotive being the latest one to become public via an IPO as opposed to a SPAC and valued as the 3rd largest auto company in the world by market cap in less than 4 trading days!). However, most of the 15 EV SPACs that have gone public since the start of 2020 (with the exception of Polestar and Lucid Motors) have seen their battery power run dry as they failed to meet their moonshot expectations. Examples include Fisker (one of the world’s first production luxury hybrid EV which already went bankrupt once even though they had the technology and the design at the time – Fisker had designed BMW’s Z8 roadster for Mr. Bond!) whilst Nikola Corp. and Lordstown Motors have been accused of “misleading” investors.

Contrast that with today’s fastest accelerating all-electric hyper car maker Rimac Automobili, another successful company created 12 years ago in the back of a garage by a 19-year old Croatian. If you are successful why would you want to raise money from strangers who are likely to pump and dump the SPAC once a reverse-merger is announced (or shortly after) when there is so much money in private equity waiting on the sidelines not to mention a potential acquiror that is already listed? Bugatti Rimac is the latest example, a joint venture between Porsche and Rimac which will eventually list next year (Bugatti will have to kiss goodbye to its 112-year petrol engine racing heritage culminating with the 8.0-litre W16 Chiron AND move its headquarters from Molsheim to Zagreb – goodbye la France!). Rimac’s founder (together with Elon Musk) was already a vivid critic of EV SPACs back in 2020 and rightly so given how challenging it is to be profitable.

In technology, the new kids on the block will always try to be more innovative than incumbents, but a SPAC is not a science project with a potential for future revenues and thus companies will need to become more serious and mature before listing. There is no reason for a SPAC to trade above its issue price before a deal is announced but as recent market participants have been playing musical chairs in FOMO (Fear Of Missing Out) we will likely have lots of disappointments to come. In addition, half of this year’s IPOs above $1 bio. are busted and trading underwater One thing is sure though, the sponsors and insiders will always make more money for themselves and the regulators will intervene at some point when it’s too late. Until then, “let the music play on…” (Barry White, 1976).


Past performance is not indicative of future results. The views, strategies and financial instruments described in this document may not be suitable for all investors. Opinions expressed are current opinions as of date(s) appearing in this material only.

References to market or composite indices, benchmarks or other measures of relative market performance over a specified period of time are provided for your information only. NS Partners provides no warranty and makes no representation of any kind whatsoever regarding the accuracy and completeness of any data, including financial market data, quotes, research notes or other financial instrument referred to in this document.

This document does not constitute an offer or solicitation to any person in any jurisdiction in which such offer or solicitation is not authorized or to any person to whom it would be unlawful to make such offer or solicitation. Any reference in this document to specific securities and issuers are for illustrative purposes only, and should not be interpreted as recommendations to purchase or sell those securities. References in this document to investment funds that have not been registered with the FINMA cannot be distributed in or from Switzerland except to certain categories of eligible investors. Some of the entities of the NS Partners Group or its clients may hold a position in the financial instruments of any issuer discussed herein, or act as advisor to any such issuer.

 Additional information is available on request.

© NS Partners Group
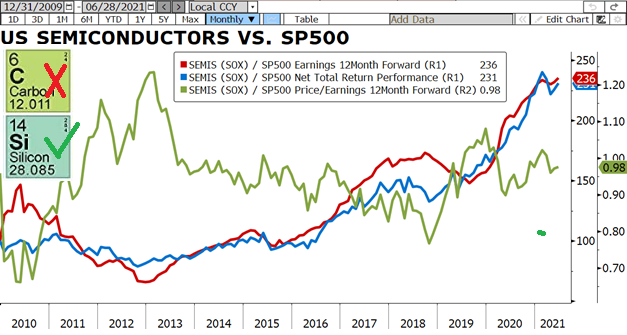
Chart of the Month – David and Goliath

Chart of the Month – David & Goliath

In modern times, the expression « David and Goliath » has taken on a popular meaning, denoting an underdog situation, when a little guy faces a bigger power, a taller person. This is an interesting parallel when we consider and confront companies of different sizes in a market.

When it comes to investing in Switzerland, we tend to pick Nestlé, Roche, Novartis among others. A portfolio’s exposure to Switzerland is often exclusively concentrated on the large caps. However, the Swiss market is just as interesting, and more diverse, when you decide to look at smaller companies. By definition, the Swiss market has demonstrated a defensive nature over time. This market is export-oriented, largely specialising in high added value products and full of specific and niche companies. It is easy to find and invest in companies with, among others, stable earnings, low beta and constant dividend. The Swiss performance extra price return index is a capitalization-weighted index composed of all companies in the SPI small & mid cap excluding any companies in the SMI Index. Over the last 5 years, performance is +66.39% (+10.73% annualised) against +54.68% (+9.12% annualised) for the famous SMI Index. This is also true over the last 10 years and, in the shorter term, over the last three years.

In terms of composition, both indices are in line across all sectors with the big difference being the exposure to the industrial and health-care sectors. With a smaller exposure to health-care and a larger exposure to industrials for the small and medium sized companies index -a sector that tends to perform well in expansionary phases and has historically reacted positively to rising inflation.

The best performers on an annualised basis over the last 5 years are Bachem (specialising in the development and manufacture of peptides and oligonucleotides), Straumann (a leader in implant and esthetic dentistry), as well as Swissquote (the leading Swiss online bank) and industrials VAT Group (high-performance vacuum valves, multi-valve units) and Interroll (products for unit-load handling systems, internal logistics and automation). They all outperformed the SMI components.

Investing in smaller companies requires being selective. You are exposing yourself to other possible issues such as liquidity, possibly lower margins and higher valuation, but on average, you get a similar dividend level and companies are in an acceleration phase of growth, facing rapid innovation.

Just like David and Goliath, in Switzerland, the little guy wins!


Past performance is not indicative of future results. The views, strategies and financial instruments described in this document may not be suitable for all investors. Opinions expressed are current opinions as of date(s) appearing in this material only.

References to market or composite indices, benchmarks or other measures of relative market performance over a specified period of time are provided for your information only. NS Partners provides no warranty and makes no representation of any kind whatsoever regarding the accuracy and completeness of any data, including financial market data, quotes, research notes or other financial instrument referred to in this document.

This document does not constitute an offer or solicitation to any person in any jurisdiction in which such offer or solicitation is not authorized or to any person to whom it would be unlawful to make such offer or solicitation. Any reference in this document to specific securities and issuers are for illustrative purposes only, and should not be interpreted as recommendations to purchase or sell those securities. References in this document to investment funds that have not been registered with the FINMA cannot be distributed in or from Switzerland except to certain categories of eligible investors. Some of the entities of the NS Partners Group or its clients may hold a position in the financial instruments of any issuer discussed herein, or act as advisor to any such issuer.

 Additional information is available on request.

© NS Partners Group

Chart of the Month – Portfolio Construction and Negative Correlation

Portfolio Construction and Negative Correlation, from the Strategy HF uncorrelated perspective.


The concept of negative correlation is a key one in portfolio construction.

Negative correlation between x,y,z, criteria enables the creation of diversified portfolios that can better withstand market volatility and smooth out portfolio returns over the long term. The building of hedge fund portfolios where the correlations are carefully balanced to provide more predictable volatility is a necessary discipline in that respect.

Therefore, this evaluation and comparative process is an important part of the Strategy HF Uncorrelated investment process.

This evaluation can take place from 2 main vectors. One is ex-post and tends to rely on historical data (track record), the other would be considered as ex-ante and relies on the identification of the funds trading style and risk profile. So, when sufficient track-record is available it can be used as the first level of analysis to identify the correlation profile of a fund vs. its peers, and other positions within the Strategy HF Uncorrelated portfolio, so to minimize the risk of convergence in specific market situations. When there are not enough data to validate the quantitative approach, understanding the fund risk profile and trading style when deploying its strategy can be a strong indicator of forward correlation to many designated markers we decide to track to maintain the Strategy HF Uncorrelated overall risk-return profile.

The first table provides an instant view of the underlying funds relations from a correlation point of view. The more negative correlation shows up the better and the more robustness can be expected. In our view, for a fund of funds like the Strategy HF Uncorrelated it is preferable to maintain the majority of correlations below 0.50 so to maintain the integrity of the risk-return profile of the portfolio. The more negative correlations show up… the even better, but not an easy task.

The second graph is a representation of the diversity of risk return profiles we hold in the portfolio and where the portfolio itself stands. It provides a visual perception of the dispersion of risk profiles of underlying funds, and the outcome of the aggregate when looking where the Portfolio seats.

These two graphs are available on a monthly basis in the Strategy HF Uncorrelated reporting.


Past performance is not indicative of future results. The views, strategies and financial instruments described in this document may not be suitable for all investors. Opinions expressed are current opinions as of date(s) appearing in this material only.

References to market or composite indices, benchmarks or other measures of relative market performance over a specified period of time are provided for your information only. NS Partners provides no warranty and makes no representation of any kind whatsoever regarding the accuracy and completeness of any data, including financial market data, quotes, research notes or other financial instrument referred to in this document.

This document does not constitute an offer or solicitation to any person in any jurisdiction in which such offer or solicitation is not authorized or to any person to whom it would be unlawful to make such offer or solicitation. Any reference in this document to specific securities and issuers are for illustrative purposes only, and should not be interpreted as recommendations to purchase or sell those securities. References in this document to investment funds that have not been registered with the FINMA cannot be distributed in or from Switzerland except to certain categories of eligible investors. Some of the entities of the NS Partners Group or its clients may hold a position in the financial instruments of any issuer discussed herein, or act as advisor to any such issuer.

 Additional information is available on request.

© NS Partners Group

Chart of the Month – Medical technology: it’s good for your wealth.

Medical technology: it’s good for your wealth.

Source: Bloomberg, Notz Stucki

Remember Grand Master Flash and the Furious Five’s lyrics in “The Message” in 1982? They pushed that girl in front of the train, took her to the doctor, sewed the arm on again, stabbed that man right in his heart, gave him a transplant for a brand-new start …. Well although it was certainly not the purpose of “The Message”, Grand Master Flash was already talking about Medical Technology: repairing what seems unrepairable in the human body.

Stents, cardiac valves, pacemakers, hearing aids, hip/knee/shoulder replacement, robotic surgery, eye and dental care, added to diagnostics, analysis and general medical supplies: these are the domains where Medical Technology companies sell their products and services.

The sector, as shown in the chart, has been an exceptional performer during the last 10 years, outperforming the MSCI World and the MSCI World Pharmaceutical Index by more than 5.3% and 6.5% respectively on an annualized basis.

Many factors explain this wide outperformance: on the pure demand side, one of the obvious drivers for Medtech is ageing population, as, to some extent, elderly need almost all the solutions provided by the sector in order to live as pleasantly as possible, as long as possible. Also, on the user side (read surgeons, dentists and doctors in general), these equipment and supplies tend to attract very strong customer loyalty: in most cases these are critical products which practitioners will be reluctant to move away from if they give satisfaction. Also, on the regulatory side, Medtech is less (but not immune) vulnerable to patent expiration.

But, perhaps, the offer side is becoming a leading force: technological advances and breakthroughs are stunning by all standards. This is where technology comes into mind, with miniaturization and digitalization in particular. Medicine is doing a lot of progress in terms of treatments, which is often supported by the immense innovations offered by Medical Technology.

Raising eyebrows after such a rally for the subsector is understandable. But at the same time, it seems clear that we’re far from seeing the nadir of what Medical Technology is able to deliver in terms of health-enhancing solutions. As a person, you want Medtech to keep on doing good for your health; as an investor, it is highly probable that Medtech will be good for your wealth.


Past performance is not indicative of future results. The views, strategies and financial instruments described in this document may not be suitable for all investors. Opinions expressed are current opinions as of date(s) appearing in this material only.

References to market or composite indices, benchmarks or other measures of relative market performance over a specified period of time are provided for your information only. Notz, Stucki provides no warranty and makes no representation of any kind whatsoever regarding the accuracy and completeness of any data, including financial market data, quotes, research notes or other financial instrument referred to in this document.

This document does not constitute an offer or solicitation to any person in any jurisdiction in which such offer or solicitation is not authorized or to any person to whom it would be unlawful to make such offer or solicitation. Any reference in this document to specific securities and issuers are for illustrative purposes only, and should not be interpreted as recommendations to purchase or sell those securities. References in this document to investment funds that have not been registered with the FINMA cannot be distributed in or from Switzerland except to certain categories of eligible investors. Some of the entities of the Notz Stucki Group or its clients may hold a position in the financial instruments of any issuer discussed herein, or act as advisor to any such issuer.

 Additional information is available on request.

© Notz Stucki Group

Chart of the Month – An interesting way to play China.

An interesting way to play China.

Source: Bloomberg, Notz Stucki

Since the emergence of the COVID-19 we are talking less about yellow fever. But during July, Chinese markets were at the epicenter of the attention of investors. Because of the Chinese government’s regulation crackdown, the MSCI China Index lost -14.3%. Some sectors were materially negatively impacted whereas others were almost immune, depending on the regulatory overhang: on a pick to through stock performance basis, new energy lost 1%, semiconductors 2%, healthcare 24%, consumer 27% and internet 52%. When looking at the 12-month trailing returns, the underperformance of China Internet versus the Nasdaq has reached unprecedented levels, closed to -65%.

The main objective of the Chinese Government is to have a stable society and this goes with wealth creation being relatively well distributed amongst people. This is why they target industries that are adding significant burden to ordinary people’s life, such as privatized education, property or online gaming. However, wealth creation is being driven by innovation lead by the private sector and the authorities will continue to support technology development such as artificial intelligence, semiconductors, automation and new energy.

Such a market move is not without consequences on investor sentiment. It will take time for some investors to regain confidence to invest in certain sectors but the Chinese economy remains vibrant with growth in many different sectors.

According to us, an interesting way to benefit from investment opportunities in Chinese equity markets is through experienced equity long/short managers able to understand and adapt to the dynamics of the markets, and with the ability to seize investment opportunities both on the long and short side which arise in the current environment. July was a real stress test and our selection of managers managed to limit the downside to one third of the market drawdown. Over the last 12 months, our selection of managers have captured 123% of the market upside and 42% of the market downside. More importantly our strategy delivered a cumulative return of 25.0% when the market lost 1.1% over the period, with a volatility of only 13.8% vs 20.4% for the Index.


Past performance is not indicative of future results. The views, strategies and financial instruments described in this document may not be suitable for all investors. Opinions expressed are current opinions as of date(s) appearing in this material only.

References to market or composite indices, benchmarks or other measures of relative market performance over a specified period of time are provided for your information only. Notz, Stucki provides no warranty and makes no representation of any kind whatsoever regarding the accuracy and completeness of any data, including financial market data, quotes, research notes or other financial instrument referred to in this document.

This document does not constitute an offer or solicitation to any person in any jurisdiction in which such offer or solicitation is not authorized or to any person to whom it would be unlawful to make such offer or solicitation. Any reference in this document to specific securities and issuers are for illustrative purposes only, and should not be interpreted as recommendations to purchase or sell those securities. References in this document to investment funds that have not been registered with the FINMA cannot be distributed in or from Switzerland except to certain categories of eligible investors. Some of the entities of the Notz Stucki Group or its clients may hold a position in the financial instruments of any issuer discussed herein, or act as advisor to any such issuer.

 Additional information is available on request.

© Notz Stucki Group

Chart of the Month – From carbon to silicon. The case to invest in semiconductors.

From carbon to silicon. The case to invest in semiconductors.

Source : Bloomberg, IBES, Notz Stucki

With the climate change, there is a huge trend to decrease the use of fossil fuels, whose main component is carbon. By chance, in the famous periodic table, silicon is just below carbon, and silicon is the main component of the semiconductor chips, which are the foundations of the digital economy. These small chips are the essential technology that makes anything computerised or digital work.

The chart above (blue line) shows the relative performance of the Philadelphia Semiconductor Index (SOX) compared to the performance of the SP500. During the last 11.5 years, this index has outperformed the SP500 by 7.8% per year!!!

What a coincidence that the profits (red line) of semiconductors have also been 7.8% higher per year!!! Once in a while the market seems to be efficient.

Where did the growth come from?

  • Communications (33% of demand), which had a phenomenal growth
  • Computers (29%). Growth has decreased but it is a main component of all computers.
  • Consumer (13%). Consumer electronic products rely on semiconductors
  • Automotive (12%). Cars are increasingly using semiconductors for many functions
  • Industrial (12%). Microcontrollers, power devices, sensors, etc, all need semiconductors

The important question is: Where will the future demand come from?

  • OLD: Communications, computers, consumers, industrials will continue to use more and more chips as the economy continues to “digitalise”.
  • NEW: Electric and Hybrid vehicles need between 3.0 and 3.3 times more chips than a traditional vehicle, and the new economy is going to migrate at an accelerated rate to electric vehicles.
  • NEW: 5G will enable the wide use of the Internet of Things and self-driven cars, which are going to be reliant on chips.
  • NEW: Artificial Intelligence, gaming devices, quantum computers, will all use powerful microprocessors to fulfill their requirements.

With all this use of chips, the demand of semiconductors has outstripped supply to a level such that auto makers cannot deliver enough cars due to chip shortages. Video cards are not fully available either nor video game consoles.

How much do we have to pay to get exposure to semiconductors? the green line in the chart shows the relative PE of semis at 0.98 versus the SP500, more or less in line with the average since 2009. Today, the investor pays the same earnings multiple for semis as he does for the SP500!!!

CONCLUSION

Interesting sector: it grows faster than the market; it is highly exposed to the “digital” economy; it will profit from the migration to electric vehicles; it will profit from the 5G deployment… and all of these without paying a premium!!


Past performance is not indicative of future results. The views, strategies and financial instruments described in this document may not be suitable for all investors. Opinions expressed are current opinions as of date(s) appearing in this material only.

References to market or composite indices, benchmarks or other measures of relative market performance over a specified period of time are provided for your information only. Notz, Stucki provides no warranty and makes no representation of any kind whatsoever regarding the accuracy and completeness of any data, including financial market data, quotes, research notes or other financial instrument referred to in this document.

This document does not constitute an offer or solicitation to any person in any jurisdiction in which such offer or solicitation is not authorized or to any person to whom it would be unlawful to make such offer or solicitation. Any reference in this document to specific securities and issuers are for illustrative purposes only, and should not be interpreted as recommendations to purchase or sell those securities. References in this document to investment funds that have not been registered with the FINMA cannot be distributed in or from Switzerland except to certain categories of eligible investors. Some of the entities of the Notz Stucki Group or its clients may hold a position in the financial instruments of any issuer discussed herein, or act as advisor to any such issuer.

 Additional information is available on request.

© Notz Stucki Group