
Chart of the Month – Nowhere to run, nowhere to hide

Chart of the month – Nowhere to run, nowhere to hide

chart of the monthThose of you that have aged well will remember the Billboard Hot 100 single “Nowhere to Run” by Martha Reeves & The Vandellas which was released in 1965 by Motown and copied & remixed by many such as The Isley Brothers, Laura Nyro, Michael Bolton and The Commitments (for you younger folks out there). At the time the 60% equities / 40% bonds (“balanced”) portfolio had already been around for over 10 years, invented by Nobel prize winner Harry Markowitz. The classic 60/40 portfolio has delivered an annualized return of 4.54% over the last 28 years with a Sharpe of 0.44. Fast forward to today and the conventional model which has been so successful historically has suddenly been turned on its head and questioned as the benchmark index was down 14.4% YTD as of mid-May! This is the worst synchronized decline for equity and fixed income benchmarks in history. So, have hedge funds finally earned their place at the dinner table? Not the case this year for most of the successful equity long short names in the industry, irrespective of their geographical focus.

Exactly two years ago, we wrote a piece titled “Survival of the Fittest” which was to be the blueprint for the enhancement of our multi-strategy low volatility mandate which had been running for over 20 years. A year later we wrote the sequel “In Pursuit of Looking Sharpe” after having implemented the changes outlined in our blueprint by adding a number of multi-PM platforms to the portfolio. In summary, the success of the multi-PM model is predicated on their ability of imposing strict stop-loss guardrails in order to prevent drawdowns in addition to being the most efficient allocators of capital to differentiated sources of alpha. Furthermore, multi-PM platforms are increasingly working with external managers enabling them to outperform their peers and produce higher Sharpe ratios (in addition to avoiding high acquisition costs associated with the traditional turf wars between the larger funds). Fast forward to today and as they say “the proof is in the pudding” following two years of live track record in the enhanced mandate. And thus, we truly have an all-weather approach as an alternative to fixed income that enables you to sleep well at night without having to worry about the extreme intra-day moves we have been witnessing of late.

This month’s chart illustrates the sum of all the monthly drawdowns of the MSCI World Index over the last 2 years stacked up against the returns of our multi-strategy low volatility mandate during the same periods. So far, we are pleased with the live crash-test results with a spread of 33.75%, thus making it a viable “alternative” to traditional portfolios. This year Value, Growth and Momentum have been the biggest driver of single stock volatility (and unfortunately Quality has become correlated to Momentum recently) with many of the largest and most successful managers in the equity long / short space witnessing their largest drawdowns of their investment careers. In striking contrast, the equity long / short managers within the multi-PM platforms have been able to perform well due their factor awareness (if not factor neutrality in some cases) together with their low net market exposure.

Remember this famous quote: Crises take much longer to arrive than you believe and they happen much faster than you thought they could (the late Rudi Dornbusch – the economist who graduated from the University of Geneva)!


Past performance is not indicative of future results. The views, strategies and financial instruments described in this document may not be suitable for all investors. Opinions expressed are current opinions as of date(s) appearing in this material only. References to market or composite indices, benchmarks or other measures of relative market performance over a specified period of time are provided for your information only. NS Partners provides no warranty and makes no representation of any kind whatsoever regarding the accuracy and completeness of any data, including financial market data, quotes, research notes or other financial instrument referred to in this document. This document does not constitute an offer or solicitation to any person in any jurisdiction in which such offer or solicitation is not authorized or to any person to whom it would be unlawful to make such offer or solicitation. Any reference in this document to specific securities and issuers are for illustrative purposes only, and should not be interpreted as recommendations to purchase or sell those securities. References in this document to investment funds that have not been registered with the FINMA cannot be distributed in or from Switzerland except to certain categories of eligible investors. Some of the entities of the NS Partners Group or its clients may hold a position in the financial instruments of any issuer discussed herein, or act as advisor to any such issuer.  Additional information is available on request.

© NS Partners Group

Chart of the Month – During economic slowdown, increase defensive sectors

During economic slowdown, increase defensive sectors

Source: NS Partners, Bloomberg

The last few months have been very special. And recent economic and geopolitical developments have left investors scrambling for answers in the equity market. Where to invest? where to hide? And in which sectors? Should I invest in value stocks rather than growth companies? In defensive rather than cyclical sectors?

There has been a wide disparity on sectors valuation recently, with Price Earnings ratios surging since March 2020. In 2022, overvalued stocks were the most impacted regardless of their sector. There was no magic protection formula. Only small places to hide. So, beyond the proper diversification that we all try to achieve, what can we do?

One simple answer is: during economic downturns or recessions, one should periodically add defensive stocks to one’s portfolio.

Looking back over the last 5 years, there are two prominent examples. Firstly, in 2018, growing evidence of a general slowdown pushed investors to the safety side, especially at the end of a very difficult year in terms of relative performance. Then again, in 2020, when the pandemic-related shutdowns stated to impact the economic growth. What did we observe during these two periods? A marked outperformance of defensive sectors, with for instance, an outperformance of pharmaceutical companies relative to the market, as well as an outperformance of consumer staples relative to consumer discretionary, which is cyclical by nature. We used to say that consumer staples stocks are expensive. But lately, once again, the sector demonstrates its low volatility behavior. Unlike other sectors where valuations have boomed and then fallen in the last two years, the sector has maintained a PE next 12 months close to 20x (20.0x for 26.04.2017 and 20.6x at the end of April 2022).

Today, there are obviously other elements that have entered the decision matrix, including the rise in interest rates, Covid which is still present and the Russian invasion of Ukraine, which brings significant geopolitical risk and implications on commodity prices, supply chain issues, … In the US, real gross domestic product (GDP) growth stood at 5.5% in the fourth quarter of 2021 and is expected to sharply decrease to 2.1% in 2023. The same trend can also be seen for Europe.

Then the conclusion is clear: as the world economy will slow down, if one wants to stay invested in equities, one should go to non-cyclical companies, periodically overweighting defensive sectors (especially consumer staples sector and pharmaceutical companies), and diversify exposure at countries level. One example might be Swiss market. The large Swiss exposure to staples and pharma through Nestlé, Roche and Novartis is well known. More than half of the Swiss market is composed by defensive stocks (far more than in the World Index).


Past performance is not indicative of future results. The views, strategies and financial instruments described in this document may not be suitable for all investors. Opinions expressed are current opinions as of date(s) appearing in this material only. References to market or composite indices, benchmarks or other measures of relative market performance over a specified period of time are provided for your information only. NS Partners provides no warranty and makes no representation of any kind whatsoever regarding the accuracy and completeness of any data, including financial market data, quotes, research notes or other financial instrument referred to in this document. This document does not constitute an offer or solicitation to any person in any jurisdiction in which such offer or solicitation is not authorized or to any person to whom it would be unlawful to make such offer or solicitation. Any reference in this document to specific securities and issuers are for illustrative purposes only, and should not be interpreted as recommendations to purchase or sell those securities. References in this document to investment funds that have not been registered with the FINMA cannot be distributed in or from Switzerland except to certain categories of eligible investors. Some of the entities of the NS Partners Group or its clients may hold a position in the financial instruments of any issuer discussed herein, or act as advisor to any such issuer.  Additional information is available on request.

© NS Partners Group
Graphique du mois – Conversation avec un gérant de portefeuille L/S dans le secteur de l’énergie

Conversation avec un gérant de portefeuille L/S dans le secteur de l’énergie

Source: UBS

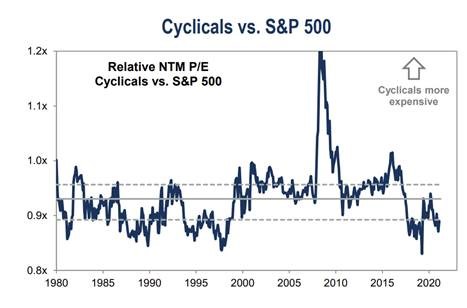
Le secteur mondial de l’énergie reste très bon marché par rapport à sa tendance historique, ce qui n’est pas le cas du marché dans son ensemble (les graphiques ci-dessous comparent les valorisations relatives entre les secteurs et le marché en général; le ratio cours/bénéfice de l’énergie est toujours de 11,8 fois, un niveau inférieur à ses moyennes historiques, alors que le marché affiche une prime proche de 20 fois).

Le potentiel de normalisation des multiples relatifs est donc très important entre titres value et valeurs croissance, surtout si l’on tient compte de l’accent mis par les équipes de direction des groupes énergétiques sur les performances et la rentabilité du capital (le secteur devrait enregistrer un ROCE >20% au cours des prochaines années, un niveau supérieur à tout autre secteur, ainsi que dans certains cas un rendement du capital à deux chiffres). La situation du secteur énergétique contraste avec celle de secteurs «stimulés» par la libération de la demande accumulée – c’est-à-dire la consommation discrétionnaire et les technologies de l’information, dont les valorisations sont encore élevées par rapport à leurs niveaux historiques.

Le graphique ci-dessous présente la capitalisation boursière du secteur de l’énergie en pourcentage de l’indice S&P, qui reste proche de ses plus bas : 4% contre une moyenne de 8% sur 20 ans. Ce qui témoigne du degré de déconnexion entre sa valorisation et ses tendances historiques et le marché dans son ensemble.


Les performances passées ne garantissent pas les résultats futurs. Les opinions, stratégies et instruments financiers décrits dans le présent document peuvent ne pas convenir à tous les investisseurs. Les opinions énoncées sont celles valables à la date de publication de ce document. Toute référence aux indices de marches ou composites, indices de référence, ou autres mesures de performance relative des marches a une certaine période sont indiquées à titre d’information. NS Partners ne donne aucune garantie et n’est aucunement responsable de l’exactitude et de l’exhaustivité de l’ensemble des informations (données financières de marche, cours de bourse, avis de recherche ou description de tout autre instrument financier) contenus dans ce document. Le présent document n’est pas destiné aux personnes ou entités qui seraient citoyennes ou résidentes d’un lieu, état, pays ou juridiction dans lesquels sa distribution, sa publication, sa mise à disposition ou son utilisation seraient contraires aux lois ou règlements en vigueur. Les informations et données fournies dans le présent document sont communiquées à titre indicatif uniquement et ne constituent ni une offre, ni une incitation à acheter, vendre ou souscrire a des titres ou tout autre instrument financier. Il est fait référence dans ce document a des fonds d’investissement qui n’ont pas été enregistrés auprès de la Finma et ne peuvent donc pas être distribues en ou depuis la suisse sauf à certaines catégories d’investisseurs éligibles. Certaines des sociétés du groupe NS Partners ou ses clients peuvent être détenteurs d’une position dans les instruments financiers de l’un des émetteurs mentionnes dans ce document, ou agir en tant que consultant pour l’un d’eux. Des informations supplémentaires sont disponibles sur demande.

© Groupe NS Partners

Gráfico del mes – Conversación con un gestor de cartera L/S de energía

Conversación con un gestor de cartera L/S de energía

Source: UBS

El sector energético global sigue ofreciendo valoraciones muy bajas desde el punto de vista histórico, a diferencia del mercado en general (en los gráficos siguientes, donde se comparan las valoraciones relativas entre los distintos sectores y el mercado en general, las acciones energéticas siguen muestran todavía un ratio precio-beneficio de 11,8x, lo que supone un descuento con respecto a la media histórica, mientras que el mercado en general cotiza a aproximadamente 20x, una prima).

Por tanto, puede haber mucho margen para que los múltiplos relativos normalicen el value frente al growth, sobre todo si se tiene en cuenta el enfoque de los equipos de gestión de la energía en la rentabilidad y el retorno del capital (el sector está en condiciones de registrar un ROCE de más del 20% en los próximos años, compitiendo con cualquier sector del mercado, así como, en algunos casos, un retorno del capital de dos dígitos). Esto se compara con otros sectores «movidos por estímulos» con un tirón de la demanda, por ejemplo, el sector de consumo discrecional y tecnología de la información, que siguen presentando valoraciones desde el punto de vista histórico.

En el gráfico de abajo se muestra la capitalización bursátil del sector energético como porcentaje del S&P, que sigue prácticamente en mínimos: 4% frente a la media de 20 años del 8%. Esto muestra el grado de desvinculación de la valoración con las medidas históricas y el mercado en general.


Los resultados pasados no implican resultados futuros. Las opiniones, estrategias e instrumentos financieros que se describen en el presente documento pueden no ser convenientes para todos los inversores. Las opiniones expresadas son sólo las del momento en la(s) fecha(s) que aparece(n) en este material.  Las referencias a índices de mercado o compuestos, índices de referencia u otras medidas de resultados relativos de los mercados durante un período específico sólo se proveen a título informativo. NS Partners no garantiza ni es responsable de la exactitud o la integridad de las informaciones (datos financieros de mercado, precios de bolsa, resultados de investigación u otros instrumentos financieros) que se mencionan en este documento.  El presente documento no constituye una oferta ni solicitud a ninguna persona ni jurisdicción donde tal oferta o solicitud no esté autorizada ni a ninguna persona a quien sería ilegal hacer dicha oferta o solicitud. Toda referencia en este documento a instrumentos específicos o a emisores sólo tiene una finalidad ilustrativa y no debe ser interpretada como una recomendación para la compra o venta de dicho instrumento. Las referencias en este documento a fondos de inversión se aplican a fondos que no han sido registrados por la Finma y que por lo tanto no pueden ser distribuidos en o desde suiza excepto a ciertas categorías de inversores. Algunas de las empresas del grupo NS Partners o sus clientes pueden tener posiciones en los instrumentos financieros de alguno de los emisores mencionados en este documento, o ser asesor de uno de ellos. Hay información adicional disponible a solicitud.

© Grupo NS Partners

Chart of the Month – Conversation with an energy L/S portfolio manager

Conversation with an energy L/S portfolio manager

Source: UBS

The Global Energy Sector is still very cheap vs history – which differs from the broader market (charts below which compare relative valuations between different sectors and the broader market, Energy is still trading at 11.8x P/E, a discount to historical averages vs. the broader market trading at ~20x, a premium).

So potentially plenty of room for relative multiples to normalize value vs. growth, especially given the focus from energy management teams on return on and return of capital (the space is set to see >20% ROCE over the coming years, which competes with any market sector, as well as in some cases double digit return of capital yields). This compares to other ‘stimulus driven’ sectors where there is a pull forward of demand – ie, cons discretionary and info tech which are still elevated vs. historical valuations.

The chart below illustrates Energy Market Cap as percent of S&P, still close to the lows: 4% vs. 20 year average of 8%. This shows the degree of valuation disconnect vs. both historical measures and the broader market.


Past performance is not indicative of future results. The views, strategies and financial instruments described in this document may not be suitable for all investors. Opinions expressed are current opinions as of date(s) appearing in this material only. References to market or composite indices, benchmarks or other measures of relative market performance over a specified period of time are provided for your information only. NS Partners provides no warranty and makes no representation of any kind whatsoever regarding the accuracy and completeness of any data, including financial market data, quotes, research notes or other financial instrument referred to in this document. This document does not constitute an offer or solicitation to any person in any jurisdiction in which such offer or solicitation is not authorized or to any person to whom it would be unlawful to make such offer or solicitation. Any reference in this document to specific securities and issuers are for illustrative purposes only, and should not be interpreted as recommendations to purchase or sell those securities. References in this document to investment funds that have not been registered with the FINMA cannot be distributed in or from Switzerland except to certain categories of eligible investors. Some of the entities of the NS Partners Group or its clients may hold a position in the financial instruments of any issuer discussed herein, or act as advisor to any such issuer.  Additional information is available on request.

© NS Partners Group

Chart of the Month – Conversation with an energy L/S portfolio manager

Conversation with an energy L/S portfolio manager

Source: UBS

The Global Energy Sector is still very cheap vs history – which differs from the broader market (charts below which compare relative valuations between different sectors and the broader market, Energy is still trading at 11.8x P/E, a discount to historical averages vs. the broader market trading at ~20x, a premium).

So potentially plenty of room for relative multiples to normalize value vs. growth, especially given the focus from energy management teams on return on and return of capital (the space is set to see >20% ROCE over the coming years, which competes with any market sector, as well as in some cases double digit return of capital yields). This compares to other ‘stimulus driven’ sectors where there is a pull forward of demand – ie, cons discretionary and info tech which are still elevated vs. historical valuations.

The chart below illustrates Energy Market Cap as percent of S&P, still close to the lows: 4% vs. 20 year average of 8%. This shows the degree of valuation disconnect vs. both historical measures and the broader market.


Past performance is not indicative of future results. The views, strategies and financial instruments described in this document may not be suitable for all investors. Opinions expressed are current opinions as of date(s) appearing in this material only. References to market or composite indices, benchmarks or other measures of relative market performance over a specified period of time are provided for your information only. NS Partners provides no warranty and makes no representation of any kind whatsoever regarding the accuracy and completeness of any data, including financial market data, quotes, research notes or other financial instrument referred to in this document. This document does not constitute an offer or solicitation to any person in any jurisdiction in which such offer or solicitation is not authorized or to any person to whom it would be unlawful to make such offer or solicitation. Any reference in this document to specific securities and issuers are for illustrative purposes only, and should not be interpreted as recommendations to purchase or sell those securities. References in this document to investment funds that have not been registered with the FINMA cannot be distributed in or from Switzerland except to certain categories of eligible investors. Some of the entities of the NS Partners Group or its clients may hold a position in the financial instruments of any issuer discussed herein, or act as advisor to any such issuer.  Additional information is available on request.

© NS Partners Group
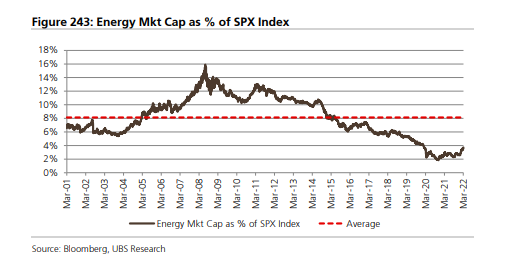
Chart of the Month – Conversation with an energy L/S portfolio manager

Conversation with an energy L/S portfolio manager

Source: UBS

The Global Energy Sector is still very cheap vs history – which differs from the broader market (charts below which compare relative valuations between different sectors and the broader market, Energy is still trading at 11.8x P/E, a discount to historical averages vs. the broader market trading at ~20x, a premium).

So potentially plenty of room for relative multiples to normalize value vs. growth, especially given the focus from energy management teams on return on and return of capital (the space is set to see >20% ROCE over the coming years, which competes with any market sector, as well as in some cases double digit return of capital yields). This compares to other ‘stimulus driven’ sectors where there is a pull forward of demand – ie, cons discretionary and info tech which are still elevated vs. historical valuations.

The chart below illustrates Energy Market Cap as percent of S&P, still close to the lows: 4% vs. 20 year average of 8%. This shows the degree of valuation disconnect vs. both historical measures and the broader market.


Past performance is not indicative of future results. The views, strategies and financial instruments described in this document may not be suitable for all investors. Opinions expressed are current opinions as of date(s) appearing in this material only. References to market or composite indices, benchmarks or other measures of relative market performance over a specified period of time are provided for your information only. NS Partners provides no warranty and makes no representation of any kind whatsoever regarding the accuracy and completeness of any data, including financial market data, quotes, research notes or other financial instrument referred to in this document. This document does not constitute an offer or solicitation to any person in any jurisdiction in which such offer or solicitation is not authorized or to any person to whom it would be unlawful to make such offer or solicitation. Any reference in this document to specific securities and issuers are for illustrative purposes only, and should not be interpreted as recommendations to purchase or sell those securities. References in this document to investment funds that have not been registered with the FINMA cannot be distributed in or from Switzerland except to certain categories of eligible investors. Some of the entities of the NS Partners Group or its clients may hold a position in the financial instruments of any issuer discussed herein, or act as advisor to any such issuer.  Additional information is available on request.

© NS Partners Group

Chart of the Month – How to become friends with Mr Market

How to become friends with Mr Market


MSCI WORLD PRICE – MSCI WORLD EPS – MSCI WORLD PRICE EARNINGS RATIO

In his famous 1949 Book “The Intelligent Investor”, Ben Graham speaks about Mr Market.
Mr Market is a strange fellow with some specific attitudes:
Mr Market is very emotional. He can be euphoric or totally depressed.
Mr Market is often irrational
But Curiously Mr Market is frequently efficient, but not always. You never know with him…
Also, Mr Market is quite sarcastic at times and he loves wrongfooting investors.

Who is this guy, Mr Market? He offers you transactions, at your option. You’re never obliged to accept, because he comes every day with new deal offers, and at new prices.
With this in mind, thanks to him you can buy low and sell high. And he makes you feel like the King of the hill. But you can unfortunately buy high and sell low. And you feel like a victim.
But it is never Mr Market’s fault: it’s you who pushes the button to buy or sell, and he serves you, because once again he’s there every day. He never forces you.

So, you get the point: Mr Market is extremely emotional in his behaviour.
But he is totally agnostic to the people working around him.
Mr Market is certainly one of the most scrutinized characters in the world and in history: scientists, strategists, economists, politicians, portfolio managers work hard to try to anticipate his mindset. To try to read his mind?
And what about the immense computer work being done on that purpose!

But Mr Market has absolutely no sentiment.
He neither hates, nor loves any single investor.
Conversely, investors switch from one sentiment to another quite frequently: when they make money, Mr Market is so nice, so smart…. In this case investors feel like they have a superior IQ. They tend to claim loudly that they understand Mr Market, he’s a good friend, they know him very well.

But sometimes the same people will not find enough insults towards Mr Market: when they lose money, he’s stupid, irrational, crazy…… they will never ever again do business with him…
The main problem with Mr Market, the source of his versatility, is that he often becomes obsessive.
The topic of his obsessions changes all the time: it can be interest rates, oil prices, monetary policy, inflation, politics or geopolitics……. This makes a lot of things to worry about.
Easy to guess that so far in 2022, Mr Market has been extremely obsessed by geopolitics with the Russia-Ukraine war, but also by inflation.

But thankfully or not, his obsessions tend to be short-lived. Except the most important: Mr Market has one and only one long term obsession: corporate earnings. If he’s confident they will rise, then he will rise accordingly. If he believes earnings might disappoint, he will discount this setback and turn pessimistic and depressive.

Like for Mr Market, earnings should be investors’ first preoccupation. Investors tend to be blinded by short term factors, forgetting the big picture.
The second preoccupation for investors should be valuations. How much do you pay for a future flow of earnings and dividends?

As shown on the Chart of the Month, Mr Market offers you today transactions at prices that are not unattractive.
Prices have come down while future earnings should rise, hence valuation have shrunk to the levels observed in 2015, 2016 and 2017.
The estimated Price Earnings Ratio for the MSCI World stands at 16 today; this is not as low as it was at the end of 2018 or in March 2020 (it was 13.5), but it is much lower than during the last 18 months (it was closer to 21 times).
This is all investors should worry about long term: are earnings expected to rise, and are valuations reasonable?

This being said, we might be witnessing a change in leadership in markets, from large caps growth, essentially Information Technology and Communication Services, to a more broad-based leadership which would include Financials, Industrials and Energy for example, and this would be healthy.

In this context, we maintain our view that a well-balanced approach with a strong focus on quality will be the right strategy going forward.
Looking back in a few years, hopefully we will claim that Mr Market is a good friend of ours, although we know, Mr Market has no friends.


Past performance is not indicative of future results. The views, strategies and financial instruments described in this document may not be suitable for all investors. Opinions expressed are current opinions as of date(s) appearing in this material only. References to market or composite indices, benchmarks or other measures of relative market performance over a specified period of time are provided for your information only. NS Partners provides no warranty and makes no representation of any kind whatsoever regarding the accuracy and completeness of any data, including financial market data, quotes, research notes or other financial instrument referred to in this document. This document does not constitute an offer or solicitation to any person in any jurisdiction in which such offer or solicitation is not authorized or to any person to whom it would be unlawful to make such offer or solicitation. Any reference in this document to specific securities and issuers are for illustrative purposes only, and should not be interpreted as recommendations to purchase or sell those securities. References in this document to investment funds that have not been registered with the FINMA cannot be distributed in or from Switzerland except to certain categories of eligible investors. Some of the entities of the NS Partners Group or its clients may hold a position in the financial instruments of any issuer discussed herein, or act as advisor to any such issuer.  Additional information is available on request.

© NS Partners Group

Chart of the Month – The contribution of alternative investments to asset allocation

The contribution of alternative investments to asset allocation

Source: Bloomberg, NS Partners

The debate around inflation is raging these days. While the arguments in favor of temporary inflation clash with those advocating the return of higher structural inflation, it is clear that the narrative of the US central bank has considerably evolved in recent months. To the point that some analysts are now wondering if the Fed simply made a major error of judgment that could lead to serious corrections in financial markets. In the short term the Fed is so “behind the curve” that it has no other choice but to start raising its key rates in March. It is also surprising to see such divergence between DM and EM central banks which already started their rate hike cycle for months. As we are writing these lines, the Fed is still injecting liquidity into markets! However, inflation is mainly a US problem today (with the exception of specific cases such as Turkey and its unorthodox monetary policy, or significant increase in European energy prices) with the combination of several factors: ultra-accommodative monetary policy, unprecedented fiscal stimulus, strong economic growth, excess household savings and record low unemployment rate leading to upward pressure on wages. On top of that, we have the China factor. Indeed, the “zero COVID” policy pursued by the Chinese authorities, coupled with relatively low herd immunity and a less effective vaccine, are causing repeated partial shutdowns of the Chinese economy. The impact on supply chains, particularly for the production of consumer goods for Western countries, is being felt. While headline inflation is quite low in China, inflation on production costs is up more than 10% year-on-year.

This situation will push the central banks of developed countries, and first and foremost the Fed, to raise rates very quickly. The rate and amplitude are difficult to predict, but the direction is clear. There are several consequences in terms of asset allocation and portfolio managers can’t remain insensitive to this change in the macroeconomic environment.

  • Regarding equities, value sectors are now significantly outperforming growth sectors, which had been the big winners of the pandemic and the last decade. Sector exposures will be key in such a macro-driven market environment going forward. With more than 10 rotations in 2021, equity markets have not been so easy to navigate. The performance of the indices can mask certain realities and the Nasdaq, which gained 22% in 2021, would only be up 9% in its 5 largest capitalizations. It seems to us that a “blended” approach with a selection of good quality companies is the right approach at this stage.
  • Regarding bonds, it seems almost impossible to expect a decent return without taking risks for which we are not paid for. The period of free money has lasted so long that certain economic realities will resurface with the end of this era and we don’t see why private debt markets would be immune to the rise in rates.

Over the past 10 years, the classic 60/40 portfolio model, i.e. 60% allocation in equities and 40% in bonds, has generated satisfactory risk-adjusted performance, but we can legitimately doubt that it will be the case for the coming months. In this context, “relative value” strategies seem particularly interesting to consider. Their objective is to deliver consistent performances, decorrelated from markets, with low volatility. There are 2 main relative value strategies:

  1. Multi-strategy multi-PM platforms, which tend to be large by assets and able to attract the best traders in the world and
  2. Smaller managers who implement niche strategies on specific market segments. With an in-depth knowledge of this investment universe, an efficient selection process and capacity to invest with the best managers, NS Partners has been able to build robust portfolios, which have delivered “all weather” returns for more than 20 years.

The chart above shows annual performances of the NS “relative value” strategy compared to the BoA-ML Global Bond and Barclays Global Aggregate 1-5Y bond indices:

  • Over the past 12 years, the strategy has posted a net average annual performance of +5.8%, compared to +3.4% and +2.2% for the two indices.
  • The annualized volatility of the strategy is only 3.1% and shows no correlation with bond markets.
  • Even more interesting, when we consider the 10 months when the US 10-year interest rate increased the most, the strategy posted an average performance of +0.96% while the BoA-ML Global Bond index posted exactly the same average performance in absolute value but with a negative sign, -0.96%!

And if you are not convinced by the past, consider the present. The Bloomberg 60/40 index lost 4.2% in January 2022 whereas the NS RV strategy is estimated to be slightly down for the month.


Past performance is not indicative of future results. The views, strategies and financial instruments described in this document may not be suitable for all investors. Opinions expressed are current opinions as of date(s) appearing in this material only. References to market or composite indices, benchmarks or other measures of relative market performance over a specified period of time are provided for your information only. NS Partners provides no warranty and makes no representation of any kind whatsoever regarding the accuracy and completeness of any data, including financial market data, quotes, research notes or other financial instrument referred to in this document. This document does not constitute an offer or solicitation to any person in any jurisdiction in which such offer or solicitation is not authorized or to any person to whom it would be unlawful to make such offer or solicitation. Any reference in this document to specific securities and issuers are for illustrative purposes only, and should not be interpreted as recommendations to purchase or sell those securities. References in this document to investment funds that have not been registered with the FINMA cannot be distributed in or from Switzerland except to certain categories of eligible investors. Some of the entities of the NS Partners Group or its clients may hold a position in the financial instruments of any issuer discussed herein, or act as advisor to any such issuer.  Additional information is available on request.

© NS Partners Group

Chart of the Month – The contribution of alternative investments to asset allocation

The contribution of alternative investments to asset allocation

Source: Bloomberg, NS Partners

The debate around inflation is raging these days. While the arguments in favor of temporary inflation clash with those advocating the return of higher structural inflation, it is clear that the narrative of the US central bank has considerably evolved in recent months. To the point that some analysts are now wondering if the Fed simply made a major error of judgment that could lead to serious corrections in financial markets. In the short term the Fed is so “behind the curve” that it has no other choice but to start raising its key rates in March. It is also surprising to see such divergence between DM and EM central banks which already started their rate hike cycle for months. As we are writing these lines, the Fed is still injecting liquidity into markets! However, inflation is mainly a US problem today (with the exception of specific cases such as Turkey and its unorthodox monetary policy, or significant increase in European energy prices) with the combination of several factors: ultra-accommodative monetary policy, unprecedented fiscal stimulus, strong economic growth, excess household savings and record low unemployment rate leading to upward pressure on wages. On top of that, we have the China factor. Indeed, the “zero COVID” policy pursued by the Chinese authorities, coupled with relatively low herd immunity and a less effective vaccine, are causing repeated partial shutdowns of the Chinese economy. The impact on supply chains, particularly for the production of consumer goods for Western countries, is being felt. While headline inflation is quite low in China, inflation on production costs is up more than 10% year-on-year.

This situation will push the central banks of developed countries, and first and foremost the Fed, to raise rates very quickly. The rate and amplitude are difficult to predict, but the direction is clear. There are several consequences in terms of asset allocation and portfolio managers can’t remain insensitive to this change in the macroeconomic environment.

  • Regarding equities, value sectors are now significantly outperforming growth sectors, which had been the big winners of the pandemic and the last decade. Sector exposures will be key in such a macro-driven market environment going forward. With more than 10 rotations in 2021, equity markets have not been so easy to navigate. The performance of the indices can mask certain realities and the Nasdaq, which gained 22% in 2021, would only be up 9% in its 5 largest capitalizations. It seems to us that a “blended” approach with a selection of good quality companies is the right approach at this stage.
  • Regarding bonds, it seems almost impossible to expect a decent return without taking risks for which we are not paid for. The period of free money has lasted so long that certain economic realities will resurface with the end of this era and we don’t see why private debt markets would be immune to the rise in rates.

Over the past 10 years, the classic 60/40 portfolio model, i.e. 60% allocation in equities and 40% in bonds, has generated satisfactory risk-adjusted performance, but we can legitimately doubt that it will be the case for the coming months. In this context, “relative value” strategies seem particularly interesting to consider. Their objective is to deliver consistent performances, decorrelated from markets, with low volatility. There are 2 main relative value strategies:

  1. Multi-strategy multi-PM platforms, which tend to be large by assets and able to attract the best traders in the world and
  2. Smaller managers who implement niche strategies on specific market segments. With an in-depth knowledge of this investment universe, an efficient selection process and capacity to invest with the best managers, NS Partners has been able to build robust portfolios, which have delivered “all weather” returns for more than 20 years.

The chart above shows annual performances of the NS “relative value” strategy compared to the BoA-ML Global Bond and Barclays Global Aggregate 1-5Y bond indices:

  • Over the past 12 years, the strategy has posted a net average annual performance of +5.8%, compared to +3.4% and +2.2% for the two indices.
  • The annualized volatility of the strategy is only 3.1% and shows no correlation with bond markets.
  • Even more interesting, when we consider the 10 months when the US 10-year interest rate increased the most, the strategy posted an average performance of +0.96% while the BoA-ML Global Bond index posted exactly the same average performance in absolute value but with a negative sign, -0.96%!

And if you are not convinced by the past, consider the present. The Bloomberg 60/40 index lost 4.2% in January 2022 whereas the NS RV strategy is estimated to be slightly down for the month.


Past performance is not indicative of future results. The views, strategies and financial instruments described in this document may not be suitable for all investors. Opinions expressed are current opinions as of date(s) appearing in this material only. References to market or composite indices, benchmarks or other measures of relative market performance over a specified period of time are provided for your information only. NS Partners provides no warranty and makes no representation of any kind whatsoever regarding the accuracy and completeness of any data, including financial market data, quotes, research notes or other financial instrument referred to in this document. This document does not constitute an offer or solicitation to any person in any jurisdiction in which such offer or solicitation is not authorized or to any person to whom it would be unlawful to make such offer or solicitation. Any reference in this document to specific securities and issuers are for illustrative purposes only, and should not be interpreted as recommendations to purchase or sell those securities. References in this document to investment funds that have not been registered with the FINMA cannot be distributed in or from Switzerland except to certain categories of eligible investors. Some of the entities of the NS Partners Group or its clients may hold a position in the financial instruments of any issuer discussed herein, or act as advisor to any such issuer.  Additional information is available on request.

© NS Partners Group