Chart of the month: From safe haven to power play: the Swiss market unleashed

From safe haven to power play: the Swiss market unleashed

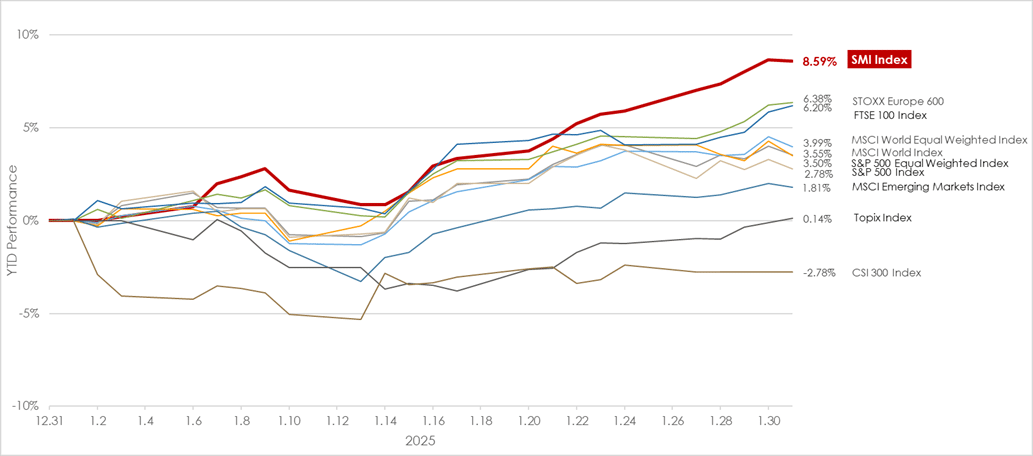
Source: Bloomberg, NS Partners


Switzerland is globally renowned for its breathtaking landscapes, world-class ski resorts, and prestigious watchmaking industry. However, beyond its scenic beauty, Switzerland boasts world-leading companies in niche industries and stands as a safe haven with untapped potential. It offers a compelling opportunity for investors seeking stability and long-term growth, supported by resilient market fundamentals and a strong economic framework.


In recent years, investors have heavily concentrated their portfolios in the U.S. technology sector, particularly in the “Magnificent 7.” However, the recent AI-driven “red wave” has highlighted the risks of overconcentration. The market’s reaction to DeepSeek’s debut served as a stark reminder of how quickly sentiment can shift, underscoring the importance of diversification. In this context, Swiss equities present a compelling opportunity. Known for their strong balance sheets and earnings growth, Swiss companies provide exposure to high-value niche industries. The Swiss market, by nature, has shown a defensive character over time, with key sectors including consumer staples, insurance, utilities, and pharmaceuticals accounting for more than half of its market composition. Post-DeepSeek turbulence, the Swiss market’s defensive qualities shine even brighter.


Since the beginning of the year, Swiss indices have outperformed global peers, with the Swiss Market Index posting impressive gains of 8.59% in January.  Demonstrating resilience on January 27th. Adding defensive position remains a time-tested strategy, amid persistent volatility and uncertainty in global markets. Swiss blue chips such as Nestlé, Roche, and Novartis continue to serve as cornerstone holdings for stability-focused portfolios. However, the true opportunity may lie beyond these household names. While large-cap Swiss stocks attract the most attention, mid-cap companies represent a largely untapped growth avenue. Mid-caps, often in their expansion phases, offer significant growth potential backed by strong fundamentals. That said, careful valuation assessments are essential to mitigate risks related to liquidity constraints and premium pricing.


Recent market movements have not disrupted the positive trajectory of several Swiss stocks, with double-digit gains in key names such as Cie Financiere Richemont, Logitech, UBS, Roche, and Partners Group. But also, gems like Galderma, Sandoz Straumann, Swissquote, Comet, Sulzer and Belimo.


Switzerland’s monetary policy remains supportive of economic growth. The Swiss National Bank is likely to maintain a dovish stance, with the potential for lower or even negative interest rates. Such a policy environment provides an additional tailwind for Swiss equities, particularly for export-oriented firms.


For investors seeking a blend of diversification, stability, innovation, and growth, Swiss equities offer a compelling solution. In today’s unpredictable market environment, having a solid Swiss allocation may not just be a luxury—it might be a necessity.


Past performance is not indicative of future results. The views, strategies and financial instruments described in this document may not be suitable for all investors. Opinions expressed are current opinions as of date(s) appearing in this material only. References to market or composite indices, benchmarks or other measures of relative market performance over a specified period of time are provided for your information only. NS Partners provides no warranty and makes no representation of any kind whatsoever regarding the accuracy and completeness of any data, including financial market data, quotes, research notes or other financial instrument referred to in this document. This document does not constitute an offer or solicitation to any person in any jurisdiction in which such offer or solicitation is not authorized or to any person to whom it would be unlawful to make such offer or solicitation. Any reference in this document to specific securities and issuers are for illustrative purposes only, and should not be interpreted as recommendations to purchase or sell those securities. References in this document to investment funds that have not been registered with the FINMA cannot be distributed in or from Switzerland except to certain categories of eligible investors. Some of the entities of the NS Partners Group or its clients may hold a position in the financial instruments of any issuer discussed herein, or act as advisor to any such issuer.  Additional information is available on request.
© NS Partners Group
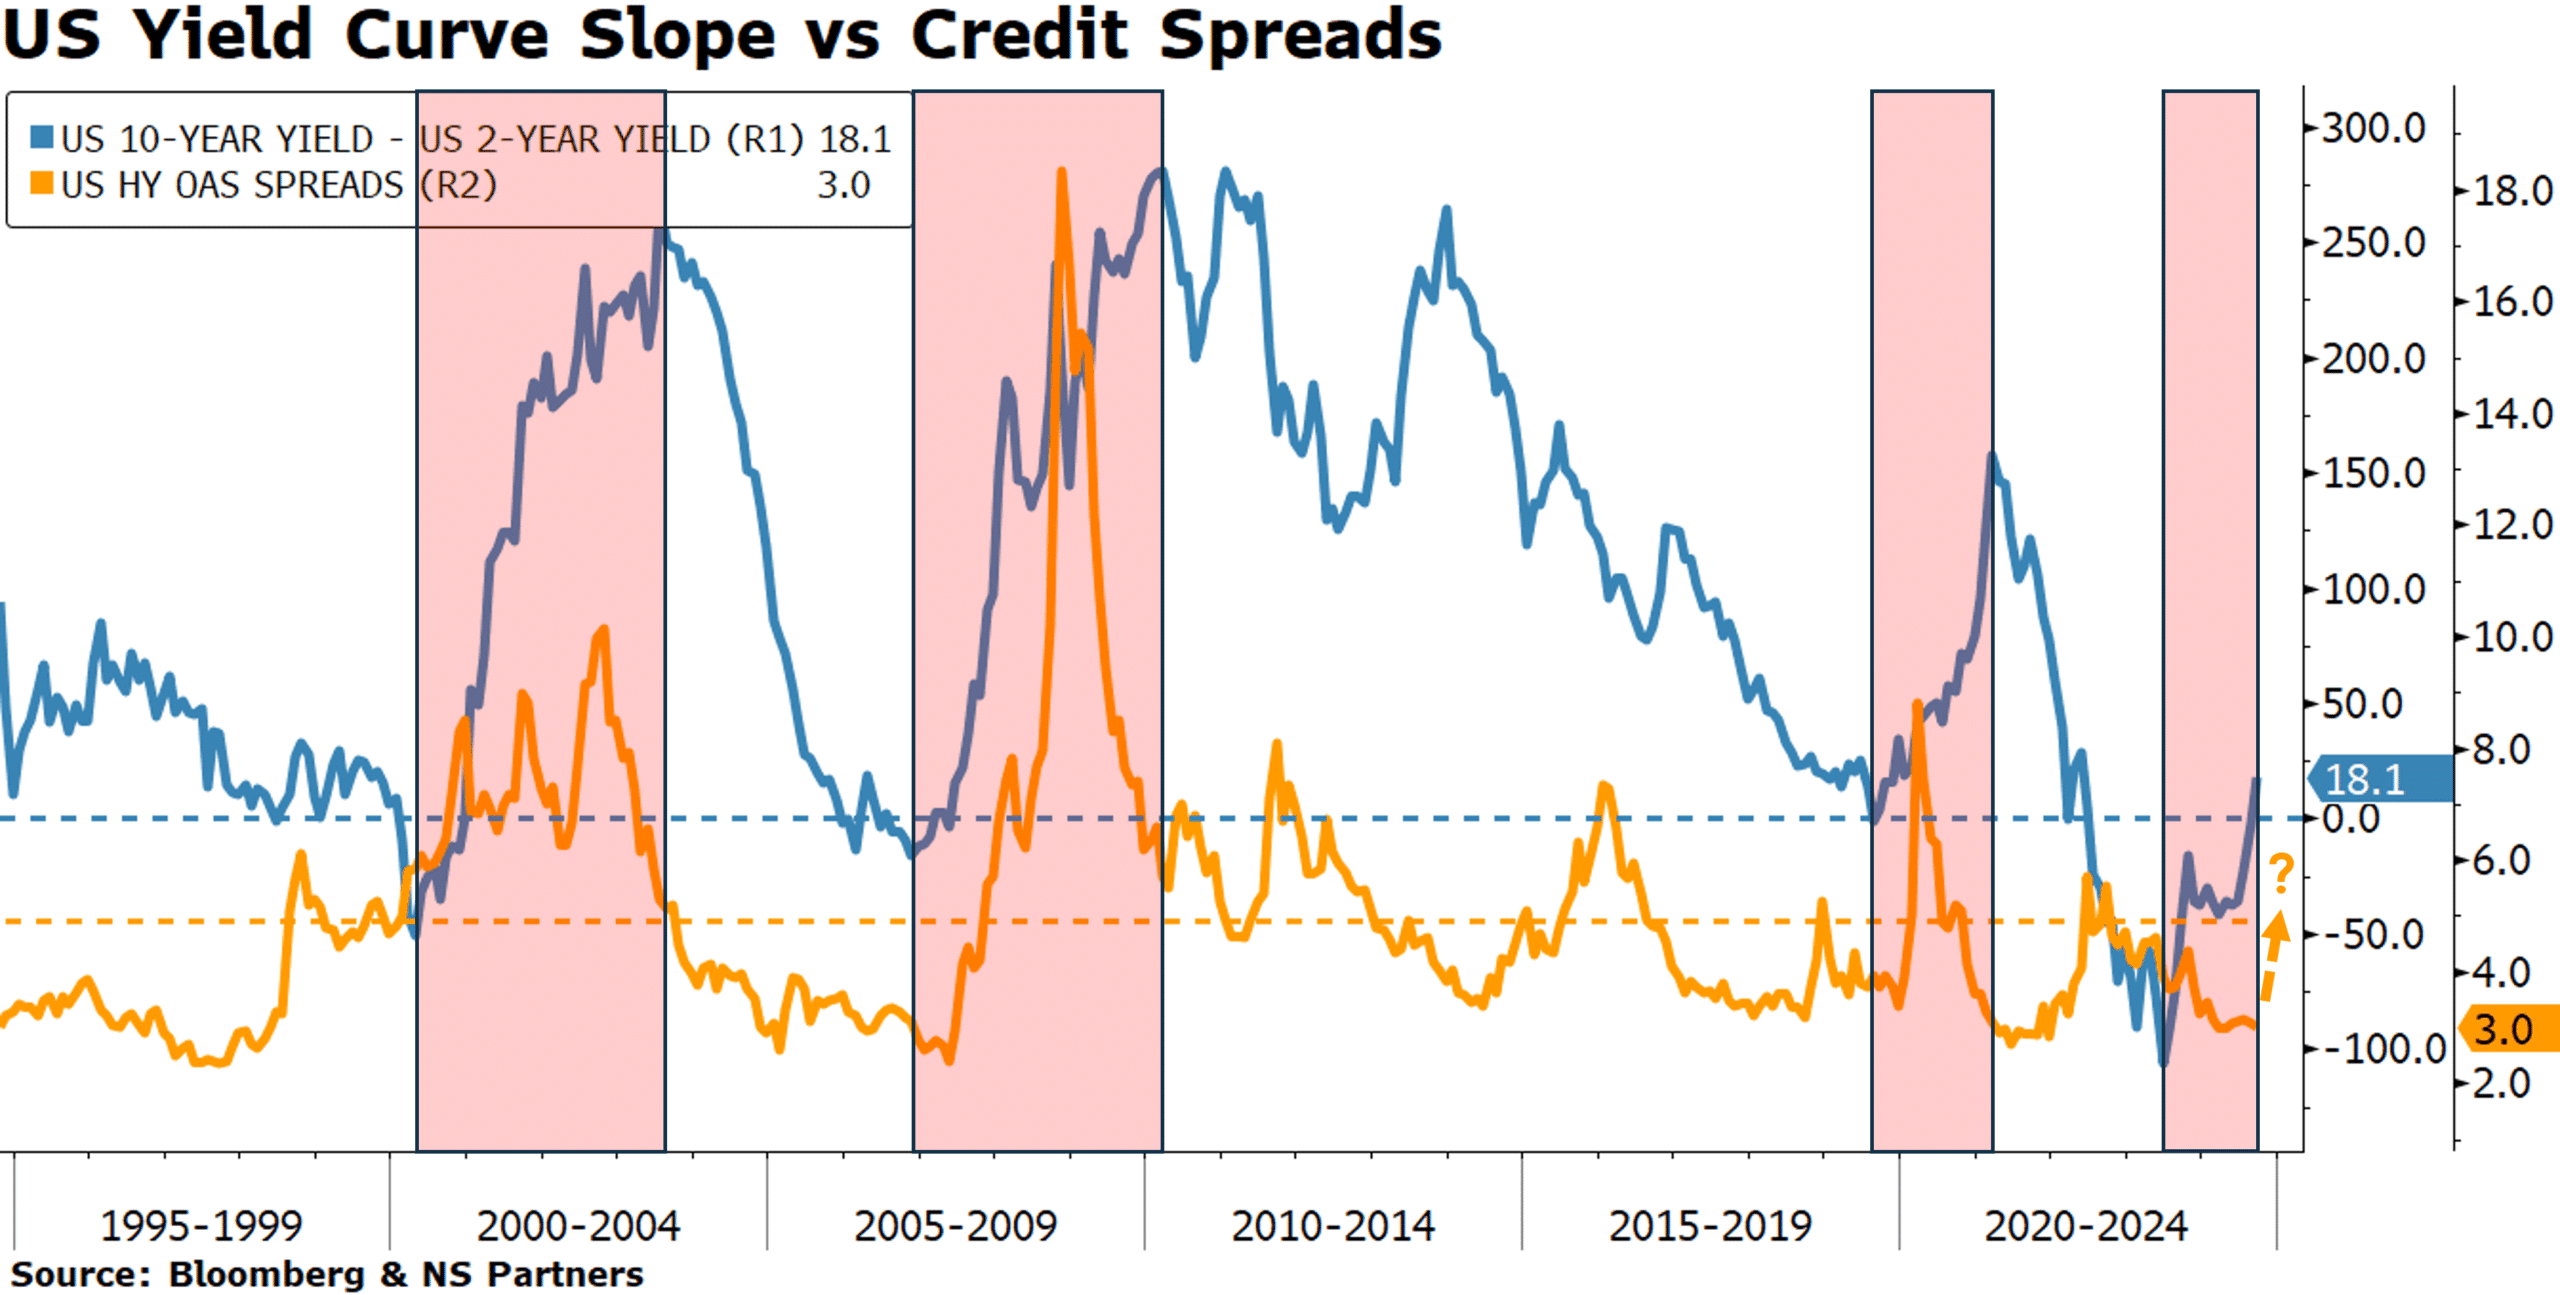
Chart of the Month: Data Centers and the AI Gold Rush

Data centers are at the heart of the AI revolution — but who are the real winners?
Are you familiar with the name Sam Brannan?

Video Player

 
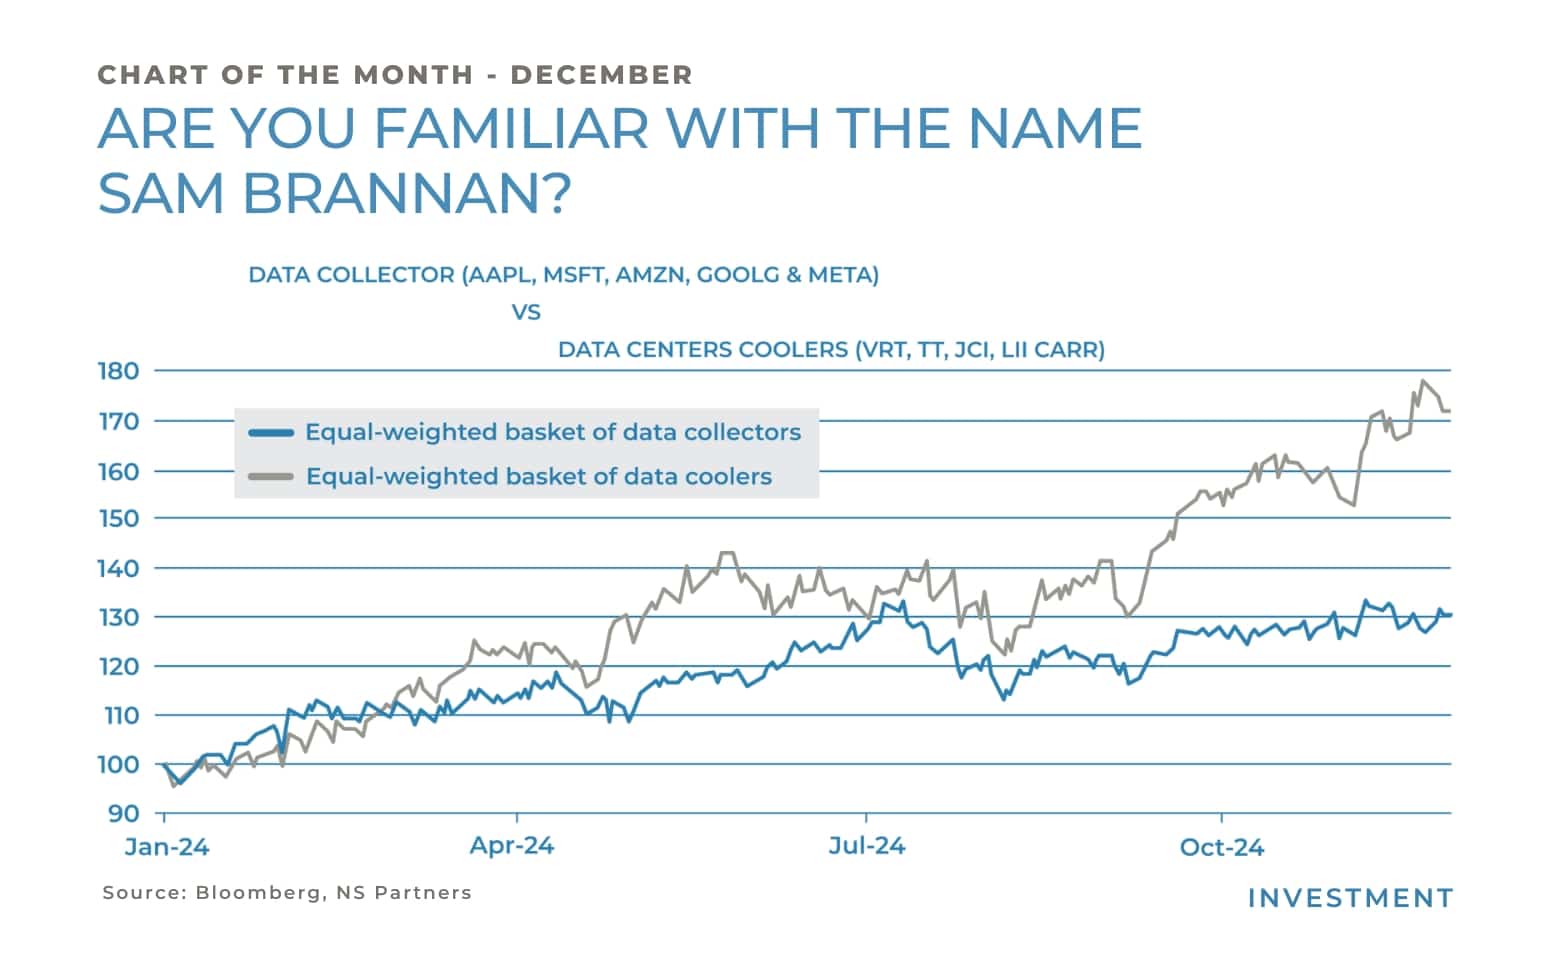
Source: Bloomberg, NS Partners


Sam Brannan is frequently cited as California’s first millionaire, during the famous Gold Rush of the 19th century. And guess what? He has never dug in the ground or sifted mud in order to find the precious gold nuggets everybody was desperately thriving for.

How did he manage to make a fortune, while staying warm, dry and clean-handed?

Well, he simply was able to sell what gold prospectors needed to try to extract the shiny stuff: picks, shovels and sieves. 300’000 people rushed in California to find gold, most of them in 1849, which gave rise to the moniker “the San Francisco 49ers”. And most of them became Brannan’s clients, eventually.

Fast forward in the 21st century, we witness a data collection and analysis rush, with the unstoppable emergence of data centers. In this context, we can easily identify the “data collectors”, like Microsoft, Apple, Amazon, Alphabet or Meta, among others

They must relentlessly invest in hardware to digest these gigantic amounts of data aimed at feeding their Artificial Intelligence ambitions. But these data centers generate high levels of heat, and therefore absolutely need cooling to function properly.

This is where a group of companies, the “data centers coolers”, come into action. Companies like Vertiv, Trane Technologies, Johnson Controls International, Lennox or Carrier provide big tech with indispensable cooling solutions.

As shown on the chart of the month, an equal weighted basket of these 5 stocks has vastly outperformed an equal weighted basket composed of Microsoft, Apple, Amazon, Alphabet and Meta in 2024.

And this confirms that, each time a big investment theme arises, the largest beneficiaries can be found well beyond the usual suspects everybody thinks about at first glance. And that’s good news: we know that the Magnificent-7 capex will be massive the next few years. And many companies will benefit from it. Heating, Ventilation and Air Conditioning stocks are just one example; from Building Materials to Energy Producers or Utility service providers, there are plenty of opportunities for good stock picking that should last for a while. It is time to be curious and look for other long-term winners in this AI craze.


Past performance is not indicative of future results. The views, strategies and financial instruments described in this document may not be suitable for all investors. Opinions expressed are current opinions as of date(s) appearing in this material only. References to market or composite indices, benchmarks or other measures of relative market performance over a specified period of time are provided for your information only. NS Partners provides no warranty and makes no representation of any kind whatsoever regarding the accuracy and completeness of any data, including financial market data, quotes, research notes or other financial instrument referred to in this document. This document does not constitute an offer or solicitation to any person in any jurisdiction in which such offer or solicitation is not authorized or to any person to whom it would be unlawful to make such offer or solicitation. Any reference in this document to specific securities and issuers are for illustrative purposes only, and should not be interpreted as recommendations to purchase or sell those securities. References in this document to investment funds that have not been registered with the FINMA cannot be distributed in or from Switzerland except to certain categories of eligible investors. Some of the entities of the NS Partners Group or its clients may hold a position in the financial instruments of any issuer discussed herein, or act as advisor to any such issuer.  Additional information is available on request.
© NS Partners Group

Chart of the month – Stock dispersion or the essence of long short equity investing

Stock dispersion or the essence of long short equity investing

Stock dispersion creates an ideal environment for long-short equity strategies. When there’s a wide range of performance among individual stocks, it provides more opportunities to identify and exploit mispricing.

Different stocks can be mispriced relative to each other. Stock dispersion allows you to take advantage of these mispricing by going long on undervalued stocks and short on overvalued ones.

Risk Management helps in managing idiosyncratic risks (risks specific to individual stocks). If one stock faces unexpected issues, the impact on your overall portfolio is mitigated by gains in other stocks.

Long-short strategies aim to generate alpha (excess returns over the market). By identifying and investing in undervalued stocks (long) and shorting overvalued stocks, you can enhance returns.

Stock dispersion helps in achieving a market-neutral position, where the portfolio is less affected by overall market movements and more by the relative performance of the stocks.

Measuring stock dispersion in the market involves assessing the variability in returns among different stocks. Here are some common methods:

Standard Deviation: Calculate the standard deviation of returns for a group of stocks. This measures the average deviation of each stock’s return from the mean return of the group.

Cross-Sectional Standard Deviation: This involves calculating the standard deviation of returns across all stocks in a given period. It’s a direct measure of how much individual stock returns differ from the average return.

Beta: Measure the beta of each stock relative to a benchmark index (e.g., S&P 500). Beta indicates how much a stock’s return moves relative to the market. A higher beta means more dispersion.

Alpha: Calculate the alpha of each stock, which measures the stock’s return relative to its expected return based on its beta. Alpha indicates the stock’s performance relative to the market.

Range of Returns: Look at the range between the highest and lowest returns within a group of stocks. This simple measure gives a quick sense of dispersion.

Interquartile Range (IQR): This measures the range between the 25th and 75th percentiles of stock returns, providing a sense of the middle spread of returns.

Dispersion Index: Some indices, like the S&P 500, have dispersion indices that measure the variability of returns among the index components12.

These methods help investors understand the degree of variability in stock returns, which is crucial for long-short strategies aiming to exploit mispricing.

Before picking your next hedge fund manager, have a look at the investment universe he is involved in and see whether there is a favorable environment to generate Alpha from idiosyncratic risks (hedge fund 101) … especially if the manager is dedicated to a limited number of sectors or a sector specialist…


Past performance is not indicative of future results. The views, strategies and financial instruments described in this document may not be suitable for all investors. Opinions expressed are current opinions as of date(s) appearing in this material only. References to market or composite indices, benchmarks or other measures of relative market performance over a specified period of time are provided for your information only. NS Partners provides no warranty and makes no representation of any kind whatsoever regarding the accuracy and completeness of any data, including financial market data, quotes, research notes or other financial instrument referred to in this document. This document does not constitute an offer or solicitation to any person in any jurisdiction in which such offer or solicitation is not authorized or to any person to whom it would be unlawful to make such offer or solicitation. Any reference in this document to specific securities and issuers are for illustrative purposes only, and should not be interpreted as recommendations to purchase or sell those securities. References in this document to investment funds that have not been registered with the FINMA cannot be distributed in or from Switzerland except to certain categories of eligible investors. Some of the entities of the NS Partners Group or its clients may hold a position in the financial instruments of any issuer discussed herein, or act as advisor to any such issuer.  Additional information is available on request.
© NS Partners Group

Chart of the Month – Credit investors: beware of the re-steepening

Credit investors: beware of the re-steepening


The slope of the US yield curve, which can be illustrated among other examples, by the difference between the US 10-year yield and the US 2-year yield has been widely used as an early indicator of recessions. Its normal slope should be positive, which means fixed income investors should be rewarded with a higher yield for buying bonds with longer maturities because, among other things, they sacrifice visibility on future inflation path and economic activity.

In the past, however, the yield curve has inverted various times between the 10-year and 2-year maturities. Some of those times include 1929, 1974 and 2008, where the inversion lasted particularly long and was followed by some well-known turbulences in the market.

The reason for these turbulences can be explained as follow: as the economy is slowing down, inflation is falling and unemployment starts rising, the market anticipates that the FED will have to cut rates to avoid a recession and to protect the labor market. Although the long-term part of the curve tends to move lower on the prospect of slower economic growth, the front end is much more reactive in reflecting the expected rate cuts from the FED. This mechanism creates what we call a bull steepening of the yield curve, where the 2-year yield drops faster than the 10-year yield.

The impact on credit spreads (a gauge of credit risk) is usually negative as we normally see a flight to safety during these periods of stress, where investors will favor quality over speculative assets, in other words, investment grade over high yield.

Over the last 30 years, as seen on the chart of this month, such occurrences also included the dot com bubble and the Covid pandemic. The shaded rectangles represent the period from the lowest point in the yield curve slope (in blue) and its highest point in the cycle. The dotted blue line is the frontier where the curve becomes inverted or positive again. We can see that credit spreads (in orange) have spiked in each of these periods to a cycle high.

Contrarily to a common misconception, it is not so much the yield curve inversion that coincides with spikes in credit spreads, but rather the re-steepening following these inversions. If we take the global financial crisis, for example, we can see that the yield curve started to invert in late 2005 already, without triggering any widening in credit spreads. It is only in the summer of 2007 (a few months after the curve hit the bottom and started rebounding) that the spreads spiked from a low of 240bps to a frightening high of 1’830bps.

As we can see in the chart, the yield curve has been inverted for more than 2 years in this cycle and has now re-steepened an impressive 124bps.

Today, credit spreads have remained muted and are below their historical average (the dotted orange line). It is of course not certain that history will repeat itself and that they will spike to new highs, but it is very unlikely that they will remain at such tight levels, especially given the uncertainty stemming from the approaching US elections and the two ongoing conflicts in Ukraine and in the Middle East.

Therefore, in such an environment, one should beware of the re-steepening of the yield curve and favor a higher quality in his or her credit portfolio.


Past performance is not indicative of future results. The views, strategies and financial instruments described in this document may not be suitable for all investors. Opinions expressed are current opinions as of date(s) appearing in this material only. References to market or composite indices, benchmarks or other measures of relative market performance over a specified period of time are provided for your information only. NS Partners provides no warranty and makes no representation of any kind whatsoever regarding the accuracy and completeness of any data, including financial market data, quotes, research notes or other financial instrument referred to in this document. This document does not constitute an offer or solicitation to any person in any jurisdiction in which such offer or solicitation is not authorized or to any person to whom it would be unlawful to make such offer or solicitation. Any reference in this document to specific securities and issuers are for illustrative purposes only, and should not be interpreted as recommendations to purchase or sell those securities. References in this document to investment funds that have not been registered with the FINMA cannot be distributed in or from Switzerland except to certain categories of eligible investors. Some of the entities of the NS Partners Group or its clients may hold a position in the financial instruments of any issuer discussed herein, or act as advisor to any such issuer.  Additional information is available on request.
© NS Partners Group

Chart of the Month – Time to reassess market risks

Time to reassess market risks


market risksThe surge in stock market volatility in August serves as a reminder that markets may be more fragile and nervous than they appear on the surface.

During this period, the VIX index, which measures the implied volatility for the S&P 500 index spiked above the 65 level. This marked the third-highest peak in its history surpassed only by the collapse of Lehman Brothers in October 2008 and the COVID-19 pandemic outbreak in March 2020. However, the circumstances of early August were far less severe than those historic crises. So, what drove such extreme market behavior?

When we witness such dramatic volatility, it’s rarely attributable to a single factor. The initial catalyst in this case was a release of US employment data that significantly undershot expectations, reigniting fears of a deeper economic slowdown in the United States. This led to a sharp decline in equity markets and a corresponding rise in the VIX, though the movement at this stage was not yet alarming. Almost simultaneously, the Bank of Japan announced a 15bps rate hike, exceeding market expectations. Both news combined triggered one of the most intense carry trade unwinding in history.

As we can see on the chart, the Nikkei index literally plunged, and the Yen surged. The S&P 500 index also corrected significantly but the VIX index spiked far more in comparison to the spot price.

The market is far more nervous than at the beginning of the year. It is clear that developed market central banks – at the exception of Japan – will cut rates to face a sharper economic slowdown but the market’s depth has been reduced.

Key considerations moving forward include:

  • NVIDIA’s Growth Trajectory: NVIDIA’s exponential rise may continue to satisfy the gigantic CAPEX from the US Tech giants, but the probability of disappointing investors is also higher now.
  • India’s Valuations: India is seeing its promising growth confirmed, but it’s also reasonable to think that the valuation of a lot of Indian stocks has become excessive.
  • Geopolitical Risks: Geopolitical tensions may be on the downside in the near future, but nothing is certain, and the current risk premium does not seem particularly high.

This volatility spike highlights how technical factors can sometimes drive markets to the detriment of fundamentals. This end-of-summer period seems to be appropriate to reassess the risks we are willing to be exposed to in our portfolios and to adopt a diversified approach in terms of asset allocation.


Past performance is not indicative of future results. The views, strategies and financial instruments described in this document may not be suitable for all investors. Opinions expressed are current opinions as of date(s) appearing in this material only. References to market or composite indices, benchmarks or other measures of relative market performance over a specified period of time are provided for your information only. NS Partners provides no warranty and makes no representation of any kind whatsoever regarding the accuracy and completeness of any data, including financial market data, quotes, research notes or other financial instrument referred to in this document. This document does not constitute an offer or solicitation to any person in any jurisdiction in which such offer or solicitation is not authorized or to any person to whom it would be unlawful to make such offer or solicitation. Any reference in this document to specific securities and issuers are for illustrative purposes only, and should not be interpreted as recommendations to purchase or sell those securities. References in this document to investment funds that have not been registered with the FINMA cannot be distributed in or from Switzerland except to certain categories of eligible investors. Some of the entities of the NS Partners Group or its clients may hold a position in the financial instruments of any issuer discussed herein, or act as advisor to any such issuer.  Additional information is available on request.
© NS Partners Group

Chart of the Month – There is life outside the SP500

There is life outside the SP500

The S&P 500 has dominated performance charts for the last decade, with its lead becoming even more pronounced in the past three years, outpacing global indices. This stellar performance is driven by several factors: a robust US economy, healthy corporate profits, and the prominence of megacap stocks benefiting from the artificial intelligence boom. Additionally, the Federal Reserve is expected to cut rates this year and potentially lower them by another 1.00% in 2025.

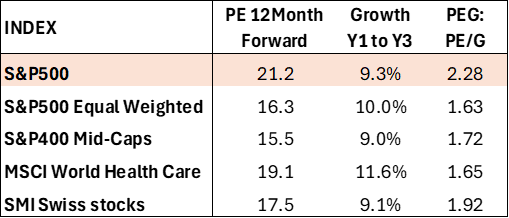
However, this impressive performance comes at a cost. The chart above compares the Earnings Yield 12-month forward (EY12MF) of the S&P 500 with the yield of a US 10-year government bond. Historically, the average gap between these two yields has been around 3.6%, but it currently stands at just 0.3%. This indicates an extreme or very extreme valuation gap, suggesting that the S&P 500 may be overvalued.

Navigating Market Timing and Seeking Alternatives

Experienced investors understand that market timing can be challenging and often frustrating. So, what should investors do with this information? Our recommendation is to diversify investments by considering the following alternatives, which offer attractive valuations and growth prospects (See table below).

S&P 500 Equal Weighted Index: Unlike the traditional S&P 500, assigns equal weight to each company, resulting in better performance during periods when smaller companies excel. It offers attractive valuation and similar growth levels, making it a compelling choice.

S&P 400 Midcap Index: This index focuses on medium-sized companies, offering a balance between growth potential and stability. With favorable valuations, it allows investors to acquire stocks at a lower price relative to their earnings growth prospects.

Health Care Sector: This sector stands out for its attractive valuation relative to expected growth and its defensive nature. This sector remains resilient during economic downturns, making it a prudent choice for stability and appreciable returns. It benefits from the ageing population trend.

Swiss Market Index (SMI): This index includes major Swiss stocks known for strong fundamentals and consistent performance. With more attractive valuations than the S&P 500 and a defensive stance, it offers a solid choice for geographic diversification.

CONCLUSION: There is a good a life also outside the S&P500


Past performance is not indicative of future results. The views, strategies and financial instruments described in this document may not be suitable for all investors. Opinions expressed are current opinions as of date(s) appearing in this material only. References to market or composite indices, benchmarks or other measures of relative market performance over a specified period of time are provided for your information only. NS Partners provides no warranty and makes no representation of any kind whatsoever regarding the accuracy and completeness of any data, including financial market data, quotes, research notes or other financial instrument referred to in this document. This document does not constitute an offer or solicitation to any person in any jurisdiction in which such offer or solicitation is not authorized or to any person to whom it would be unlawful to make such offer or solicitation. Any reference in this document to specific securities and issuers are for illustrative purposes only, and should not be interpreted as recommendations to purchase or sell those securities. References in this document to investment funds that have not been registered with the FINMA cannot be distributed in or from Switzerland except to certain categories of eligible investors. Some of the entities of the NS Partners Group or its clients may hold a position in the financial instruments of any issuer discussed herein, or act as advisor to any such issuer.  Additional information is available on request.
© NS Partners Group

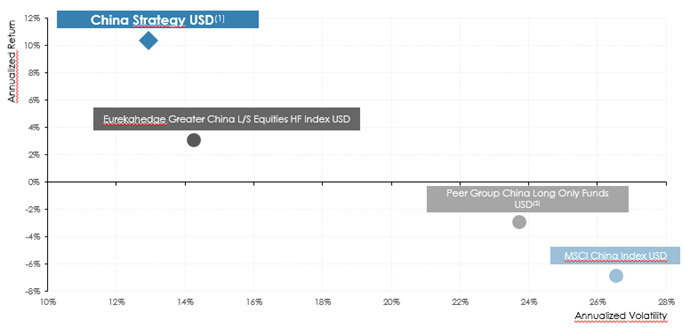
Chart of the Month – China: an interesting risk/return profile to be exposed to the region.

China: an interesting risk/return profile to be exposed to the region.

 
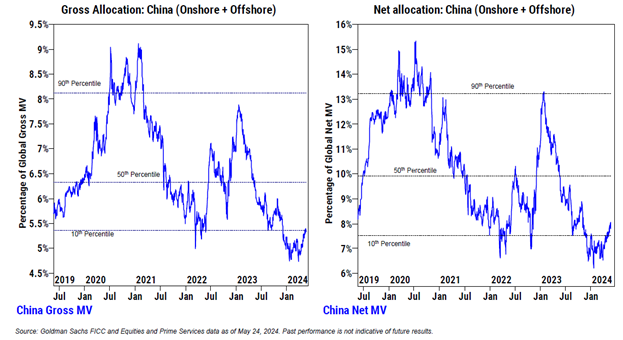
Source: NS Partners, Bloomberg. Data as of 30 April 2024. Performance in USD. Risk statistics against the MSCI China Index USD calculated on a monthly basis, with a risk-free rate of 1.0%.
(1) China B USD = Haussmann China/Asia Equity Long/Short allocation (K USD Share Class, with 1.40% management fees) from 31 December 2017 to 31 March 2021. From 1 April 2021 real track record of Mahjong China Fund B USD, net of fees. (2) Peer Group = long only China equity funds discretionary selected by NS Partners (10 funds), equally-weighted and rebalanced on a monthly basis. This slide includes historic returns and past performance is not a reliable indicator of future results. The value of investments can go down as well as up.

After 3 years of bear market in China, I see structural alpha opportunities emerging this year and managers are starting to gradually re-allocate capital in the region.

TMT stocks are the most net bought this year, information technology is the most overweight sector in this region. The financial sector remains the most underweight sector in the region, it has seen net inflows YTD but is among the most underweight ones in China.

Chinese equities continue to see slow but steady buying, with net buying flows. H shares have led the recent inflows followed by ADRs. A-shares continue to be net sold. But the most important Gross and Net allocation is gradually increasing.

Our strategy: China equity L/S multi-managers strategy can give the right diversification to investors that are willing to re-allocate capital to the region.

Managers are generating good performance so far this year. Since we started investing in the region, we had the ability to allocate capital with managers that were able to protect the capital in the down market and to generate good results in up market given good asymmetric returns.

The market in the region is structurally changed, moving from beta to alpha opportunities, thus we need to adopt rapidly to new investments regime and we need to be nimble in our approach; managers using Variable Net hedge fund approach can give the right flexibility. Overall, we prefer active investment over passive ones. Passive investments (ETFs) don’t follow the new trends that the economy is generating and active long only funds are less dynamic to move the exposure to the right sectors to capture market opportunities.

The return composition of the Chinese equities market is becoming more Alpha dominant. Stock selection has become a key driver in an environment where bifurcation of stock performance within an industry is a more common occurrence and it has also happed on a greater magnitude. After a period of systematic beta downtrend, markets are settling at a level of relatively strong support. At the same time, further clarity and stability across the economy and policy direction improve conviction level on stock selection, allowing investors to shift focus away from tail-end events and back into fundamentals.

China’s economy pivoted from export-manufacturing driven during 2000-2010, to domestic-consumption driven in 2010-20. It started another major rebalancing 2-3 years ago, amid the geopolitical tensions and its demographic challenges, to focus on self-reliance and advanced manufacturing.

Building a portfolio of local hedge fund managers adopting different strategies is the right approach to generate good risk-return performance. The universe of managers in China is big, there are hundreds of funds, manager selections is a key component.

The last 3 years was a big stress test for the managers, market experienced one of the worst drawdowns in history and I’m really convinced that from this period of bear market that big opportunities can emerge.


Past performance is not indicative of future results. The views, strategies and financial instruments described in this document may not be suitable for all investors. Opinions expressed are current opinions as of date(s) appearing in this material only. References to market or composite indices, benchmarks or other measures of relative market performance over a specified period of time are provided for your information only. NS Partners provides no warranty and makes no representation of any kind whatsoever regarding the accuracy and completeness of any data, including financial market data, quotes, research notes or other financial instrument referred to in this document. This document does not constitute an offer or solicitation to any person in any jurisdiction in which such offer or solicitation is not authorized or to any person to whom it would be unlawful to make such offer or solicitation. Any reference in this document to specific securities and issuers are for illustrative purposes only, and should not be interpreted as recommendations to purchase or sell those securities. References in this document to investment funds that have not been registered with the FINMA cannot be distributed in or from Switzerland except to certain categories of eligible investors. Some of the entities of the NS Partners Group or its clients may hold a position in the financial instruments of any issuer discussed herein, or act as advisor to any such issuer.  Additional information is available on request.
© NS Partners Group

Chart of the Month – Rotations

Rotations


I personally love skiing.

Like all ski addicts, I know what rotation means:

  1. Feet and knees trigger a change in orientation.
  2. Edge grip
  3. The upper body stays in front of the slope and does not rotate.
  4. The turn is controlled and mastered.
  5. Conclusion: rotation is necessary, good and helps

Like all equity portfolio managers, I know what rotation means:

  1. Growth outperforms Value, or Value outperforms Growth, in this secular opposition between styles.
  2. This happens whatever the direction of the market.
  3. A portfolio can suffer or profit from rotations.
  4. It is awfully difficult to time the market, and, on top of that, to time rotations.
  5. Conclusion: rotation is potentially dangerous

It’s easy to see that in skiing you are the source of the rotation, whereas in equity investing you are subject to it.

rotationsThe Chart of the Month is divided in two parts:

  1. The upper part shows the performance of the MSCI World Net Total Return in euros since 2017. It has more than doubled.
  2. The orange line in the lower part displays the relative performance of the MSCI World Growth versus the rest of the market. It has bettered the MSCI World by more than 20%, but how volatile this has been! And the blue line represents the relative performance of our equity flagship DGC Stock Selection, which has done better than both the MSCI World and the MSCI World Growth over the period.

Investors have a natural tendency to try to time the market; this is very frequently a failure. Looking at all the rotations highlighted in the Chart of the Month, they also have to cope with styles, adding another risk of failure.

We believe at NS Partners that we offer a comprehensive and reasonable equity exposure with a blended global equity fund with no style bias, as shown by the blue line in the chart of the month. As you can see, our DGC Stock Selection fund has been able to deliver an appreciable outperformance, without having been biased towards Growth or Value, but by applying a disciplined approach in terms of valuations and quality.

History tells us that long periods of outperformance from one style versus another tend to correct, but the timing is uncertain. We expect many more rotations in the future.

Like an advanced skier who will always keep his shoulders in front of the slope to make sure he controls his trajectory while rotating his feet and knees, our fund will continue to focus on quality and valuations, whatever the sector, in order to smooth out style rotations and, hopefully, deliver superior performance for investors going forward.


Past performance is not indicative of future results. The views, strategies and financial instruments described in this document may not be suitable for all investors. Opinions expressed are current opinions as of date(s) appearing in this material only. References to market or composite indices, benchmarks or other measures of relative market performance over a specified period of time are provided for your information only. NS Partners provides no warranty and makes no representation of any kind whatsoever regarding the accuracy and completeness of any data, including financial market data, quotes, research notes or other financial instrument referred to in this document. This document does not constitute an offer or solicitation to any person in any jurisdiction in which such offer or solicitation is not authorized or to any person to whom it would be unlawful to make such offer or solicitation. Any reference in this document to specific securities and issuers are for illustrative purposes only, and should not be interpreted as recommendations to purchase or sell those securities. References in this document to investment funds that have not been registered with the FINMA cannot be distributed in or from Switzerland except to certain categories of eligible investors. Some of the entities of the NS Partners Group or its clients may hold a position in the financial instruments of any issuer discussed herein, or act as advisor to any such issuer.  Additional information is available on request.
© NS Partners Group

Chart of the Month – Turbulence ahead… Buckle up!

Turbulence ahead… Buckle up!

us wages inflationOil, natural gas, commodities, electricity, grain prices have become part of our daily lives during 2022. Some of these prices have dropped significantly from the peaks in April and May; for instance, Brent price tumbled 25% from early June to today. Why are capital markets and central banks still very worried about inflation? Wages may be the answer.

When we analyze the cost component of most goods and services, wages and salaries are more important than commodity prices. If we look at the USA (Chart above) we can see that US Average hourly earnings are growing at 5.20% as of 31-August, and the Employment Cost Index is increasing at 5.1% as of 30-June. The higher wages are pushing inflation higher and corporate margins lower. Even worse, wage increases tend to be more sticky than other components of inflation, so once you have salaries growing at 5%, it takes a while to convince unions and employees to accept lower increases in their incomes.

Why are salaries growing so fast compared to history?

  • The first and most obvious reason is that workers want to, at least, maintain their income in real terms. With headline inflation running at 8.5% in the USA, even with the current wage increases, they are losing money in real terms. If the market consensus is right, this pressure will diminish during the next 12 months.
  • The second reason is that demand for workers is very high in the USA, with an economy that has been booming since the lockdowns are over. We can see in the chart that job openings are very high with many companies willing to engage more workers. With the economy slowing down, we are seeing less job openings in some markets, but they are still at very high levels. Let’s remember that with a current unemployment rate of 3.7%, technically the US is working at full capacity (Powell estimates that 4.0% is full employment).
  • The third reason is that supply of workers is relatively low. The labour market participation rate used to be at about 63.0% before the pandemic, and with the latest August data, this participation is at 62.4%. What does this mean? There are between 1.1 to 1.5 million people in the USA who have quit the labour market, creating a lack of supply, so companies are forced to increase wages to attract workers. Fear of Covid, generous social programs and people willing to retire are the reasons mentioned to explain this lower participation rate. This ratio has improved a bit but it will be necessary to go to the previous 63% to better control the salaries.

In summary, the evolution of wages is key to control inflation, to maintain interest rates lower and to maintain corporate margins at high levels. For the time being, the FED tightening will diminish the demand for workers but we need some improvement on the supply side to be able to come back to wages growing at 3%, which will be more consistent with the overall FED target of inflation at around 2%. Buckle-up for this ride!


Past performance is not indicative of future results. The views, strategies and financial instruments described in this document may not be suitable for all investors. Opinions expressed are current opinions as of date(s) appearing in this material only. References to market or composite indices, benchmarks or other measures of relative market performance over a specified period of time are provided for your information only. NS Partners provides no warranty and makes no representation of any kind whatsoever regarding the accuracy and completeness of any data, including financial market data, quotes, research notes or other financial instrument referred to in this document. This document does not constitute an offer or solicitation to any person in any jurisdiction in which such offer or solicitation is not authorized or to any person to whom it would be unlawful to make such offer or solicitation. Any reference in this document to specific securities and issuers are for illustrative purposes only, and should not be interpreted as recommendations to purchase or sell those securities. References in this document to investment funds that have not been registered with the FINMA cannot be distributed in or from Switzerland except to certain categories of eligible investors. Some of the entities of the NS Partners Group or its clients may hold a position in the financial instruments of any issuer discussed herein, or act as advisor to any such issuer.  Additional information is available on request.

© NS Partners Group

Chart of the Summer – When the FED tightens, there is (almost) no place to hide

When the FED tightens, there is (almost) no place to hide

So far, 2022 has been a tough year with many headwinds in capital markets: Russian invasion of Ukraine, new Covid cases in China bringing partial lockdowns, increasing energy and food prices, rising inflation, etc… but, if we had to just name one, we would say that the FED tightening process is the most consequential. The old sentence “Don’t fight the FED” has never been so true. During the last 4.5 months, the FED has increased its official rate from 0.25% in mid- March to 2.5%.

TRADITIONAL ASSET CLASSES:

  1. EQUITIES: High valuations, higher discount rates and lower expected economic growth have made equities lose USD19 trillion in 7 months to deliver a -12.9% High growth stocks with demanding valuations were the most vulnerable.
  2. BONDS: All bond prices have adjusted to the new reality after the FED hiked rates. Unfortunately, bonds and equities became highly correlated again and the world bond aggregate lost 6.7%, which is a very important loss for an asset class that is also known as “fixed” income.
  3. REFERENCE TRADITIONAL BENCHMARK: 60% EQUITIES + 40% BONDS: This popular reference index has lost 10.4% during the year.

Was there any hope in the alternative asset classes to compensate for the poor performance in the traditional portfolios? Not much:

  1. HEDGE FUNDS. We used the daily index, as the most common indexes are still not available as of 31 July. At least the -4.5% returns did not look that bad, although there were large differences between the more conservative ones (relative value, macro, arbitrage, etc) – which were slightly negative – and the long/short, who did not perform well, specially because they continued with a growth bias.
  2. PRIVATE EQUITY: Its returns are not available yet, so we took as proxy the Index with the listed private equity companies. As private equity is “somehow” a leveraged version of public equities, the proxy we are using posted a -22.0% Venture Capital suffered more than others with the fall of growth stocks.
  3. REAL ESTATE: Its returns are not available yet, so we took as proxy the FTSE EPRA Nareit Global REITS Net Tax in USD. Real Estate is obviously sensitive to interest rates also and this market took a hit of 13.7%.
  4. The only bright spot with a +35.3% performance. Interestingly, the energy subindex is the only one that was positive, as Agriculture, Industrial Metals and Precious Metals were flat or negative. Oil and Natural Gas were also going up before the Ukrainian conflict, and the invasion exacerbated the market.
  5. BITCOIN: The whole crypto market has gone from a USD 3 trillion market to about USD 1 trillion. Despite the different drivers of this market, it has finally become highly correlated with risky assets (Nasdaq) and has tumbled 48.6%.
  6. GOLD: Traditionally a good hedge against inflation, it has not been the case this year, although we may say that -3.5% is a decent performance compared to other assets performance.

Unfortunately, we have seen that only energy has produced positive returns this year, and the rest of the assets had negative or very negative returns. Investors still have 5 months to recover these losses, navigating in an environment that does not provide too much diversification.


Past performance is not indicative of future results. The views, strategies and financial instruments described in this document may not be suitable for all investors. Opinions expressed are current opinions as of date(s) appearing in this material only. References to market or composite indices, benchmarks or other measures of relative market performance over a specified period of time are provided for your information only. NS Partners provides no warranty and makes no representation of any kind whatsoever regarding the accuracy and completeness of any data, including financial market data, quotes, research notes or other financial instrument referred to in this document. This document does not constitute an offer or solicitation to any person in any jurisdiction in which such offer or solicitation is not authorized or to any person to whom it would be unlawful to make such offer or solicitation. Any reference in this document to specific securities and issuers are for illustrative purposes only, and should not be interpreted as recommendations to purchase or sell those securities. References in this document to investment funds that have not been registered with the FINMA cannot be distributed in or from Switzerland except to certain categories of eligible investors. Some of the entities of the NS Partners Group or its clients may hold a position in the financial instruments of any issuer discussed herein, or act as advisor to any such issuer.  Additional information is available on request.

© NS Partners Group