BUY STERLING POUND VS. US DOLLAR
CURRENT SITUATION
On June 23rd, UK citizens voted to leave the European Union (Brexit). The GBPUSD rate was 1.481 before the referendum. Two days later GBP had fallen 10.8% to 1.321. After that date, the currency has been more or less stable until October 2nd, when the new UK Prime Minister Theresa May announced that by March 2017, the UK would invoked the famous Article 50 to leave the EU. Being consistent with the message “Brexit means Brexit”, Mr. May gave a message that was perceived as a “hard Brexit”, meaning that UK wanted to control immigration and its destiny as a country. This message might indicate a tough negotiation process with the EU, which caused a further fall in the GBP to today’s level of 1.220, the lowest level since 1985 and 17.6% lower than the rate before the vote.
One of the contributors to this fall is the UK high currency account deficit of 5.7% in 2016. Consensus expect 4.4% in 2017 and 3.0% in 2018. This high numbers tend to be a drag to the country currency. Nevertheless, it is more important to know that the Net International Investment Position (NIIP) was only -6.7% as of 1Q16. Furthermore, as 60% of UK liabilities are denominated in foreign currencies and 90% of the assets, the NIIP might be positive as of today (Figures taken from the Bank of England report published in July16)
NET SPECULATIVE POSITIONS
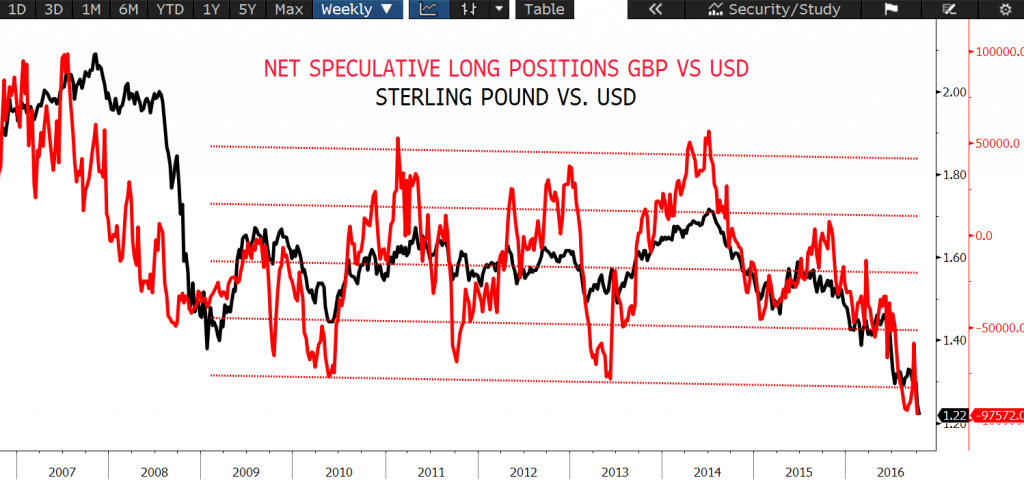
The chart above shows the net speculative positions in the GBPUSD futures market (red line). This measure tends to be a very good CONTRARIAN indicator when the positions are very extreme, and we have reached this week a 2 standard deviation reading, which in the past has been a good short-term trading indicator. Interesting to remember the famous Buffett sentence: “Be fearful when others are greedy and greedy when others are fearful”.

TECHNICAL OSCILLATORS – MACD
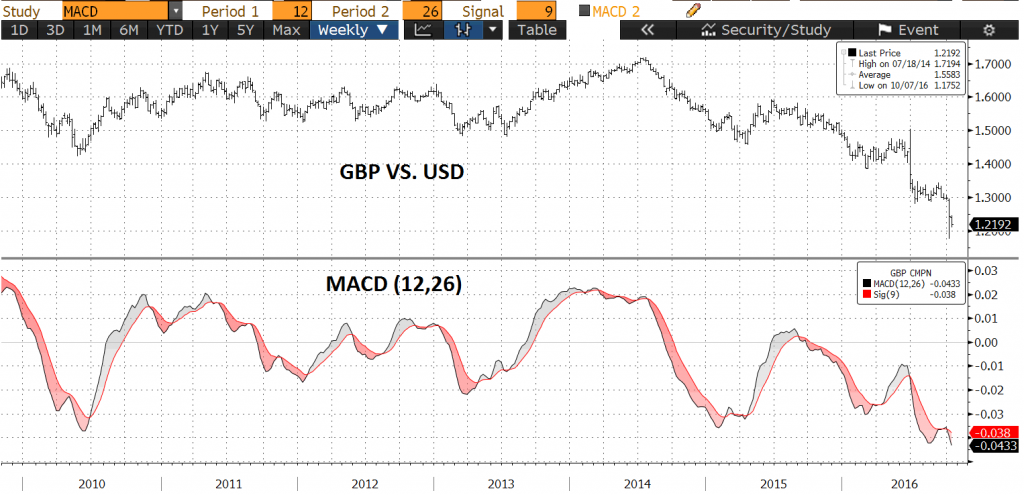
From the technical point of view, the most widely used oscillators (RSI, MACD, etc) are telling us also that the GBP is oversold. The chart below shows just the MACD which is at levels that reflect an extreme oversold situation, and so a good contrarian indicator

PURCHASING POWER PARITY (PPP)
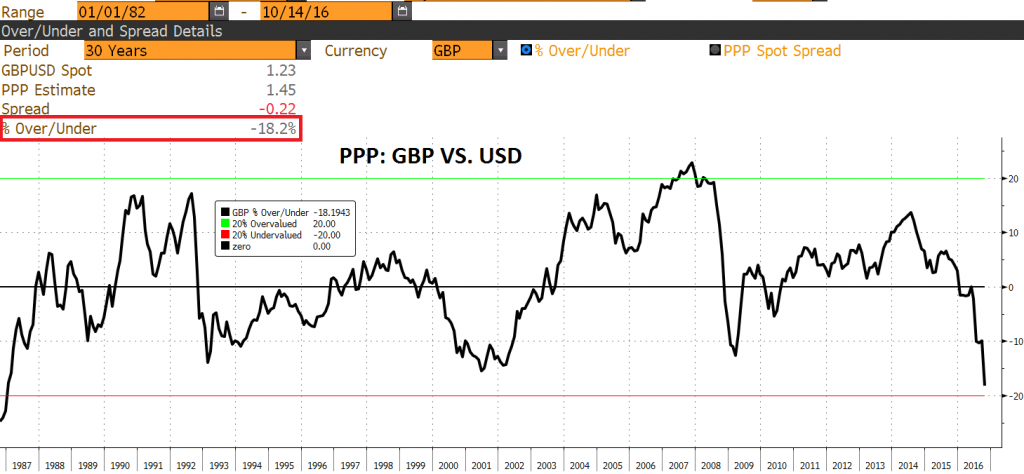
PPP is not a good indicator on a short-term basis, as currencies can remain overvalued or undervalued for a long time, but it gives a reasonable indication of long-term value. It is better to trade with a positive tailwind behind us. The chart below shows that the GBP is trading at the lowest level on a PPP basis since 1986, and again, 2 standard deviations below the average (we took this idea/graph from Charles Gave on a note to investors sent on October 11th).

RECOMMENDATION
There is a clear political risk and uncertainty in the UK after the Brexit, and there is also a high current account deficit in the UK, but several indicators point to an overshoot in the value of the GBP. A drop of 17.6% in the currency value of the 6th largest economy in the world (France has overtaken the UK after the recent GBP fall) is more typical of an unbalanced emerging market economy. The United Kingdom is a serious country with solid democratic institutions, with savvy corporate managers, with great universities, with a positive Net International Investment Position today, great human capital, etc, so we may expect at least a short term recovery in the next 3-6 months.