China Narrows The AI Capability Gap

CHINA NARROWS THE AI CAPABILITY GAP
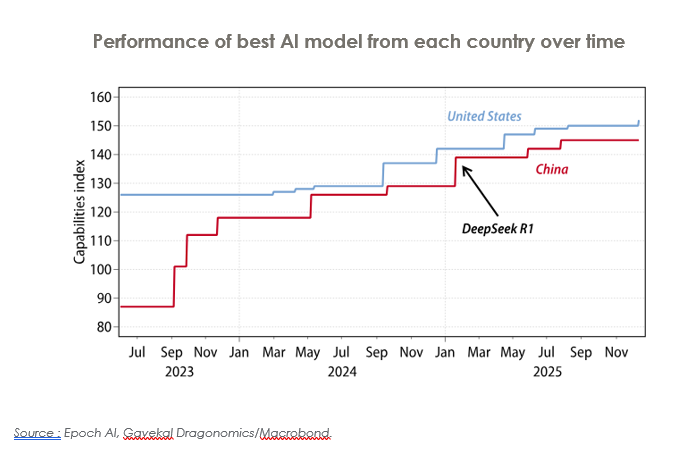
This month’s chart illustrates one of the most significant developments in the global technology landscape: the rapid rise of China’s frontier AI capabilities and the narrowing performance gap with the United States. The graph tracks the top-performing AI model from each country between mid 2023 and late 2025. While the United States maintains a slight lead throughout the period, the visual trend is unmistakable: China is accelerating quickly, with breakthrough moments that reshape expectations about global AI competition.
The most dramatic shift occurs in early 2025 with the release of DeepSeek R1, highlighted in the chart. This model marks a turning point not only in China’s domestic AI progress but also in the broader perception of what Chinese companies can achieve under resource constraints. According to the European Union Institute for Security Studies, DeepSeek R1 demonstrated performance on par with leading American models while using far less computing power and dramatically lower training costs, challenging the assumption that semiconductor export restrictions would slow China’s progress. This breakthrough signals a structural shift: algorithmic efficiency and model design have become strategic strengths within China’s AI ecosystem.
Stanford University’s 2025 AI Index report supports the trend displayed in the graph, noting that China has significantly closed the performance gap with the United States, even though the U.S. continues to produce more frontier models overall. Chinese models such as DeepSeek R1 now rank very close to top U.S. systems on independent benchmarks including LMSYS. The chart reflects this convergence clearly, as the red line representing China rises sharply from 2023 onward, narrowing the distance with the U.S. trajectory.
DeepSeek R1’s impact also stems from its unprecedented efficiency. Reports indicate that the model was trained for approximately $6 million, far below the estimated $100 million-plus investment required for models like OpenAI’s GPT-4. This efficiency not only enabled rapid iteration but also disrupted global markets, with U.S. technology stocks experiencing significant volatility following the model’s release. The economic effects reinforce what the chart shows technologically: China is no longer simply following developments in AI but increasingly shaping the competitive landscape.
Beyond individual models, China’s broader AI ecosystem has strengthened in ways that help explain the steep upward trajectory seen in the graph. Chinese companies have embraced open-source development, improving adoption and accelerating innovation cycles. They have also benefited from strong government support, growing domestic talent pipelines, and an expanding volume of high-quality research output. According to Recorded Future’s 2025 analysis, Chinese generative AI models now trail U.S. counterparts by only three to six months, a remarkably small window given earlier expectations and one that aligns directly with the chart’s near convergence by late 2025.
Overall, the chart captures a moment of profound technological shift. While the United States retains a narrow lead in frontier AI models, China’s rapid progress—driven by efficiency, innovation, and strategic investment—has brought the two countries closer than at any previous point. The upward movement of China’s capability line is not just steep; it is indicative of a maturing ecosystem capable of producing globally competitive models despite resource constraints and external pressures. As the pace of development continues, the global AI landscape in 2026 and beyond is likely to be more multipolar, more competitive, and more dynamic than ever before.
Written by Gabriele Casati
Past performance is not indicative of future results. The views, strategies and financial instruments described in this document may not be suitable for all investors. Opinions expressed are current opinions as of date(s) appearing in this material only. References to market or composite indices, benchmarks or other measures of relative market performance over a specified period of time are provided for your information only. NS Partners provides no warranty and makes no representation of any kind whatsoever regarding the accuracy and completeness of any data, including financial market data, quotes, research notes or other financial instrument referred to in this document. This document does not constitute an offer or solicitation to any person in any jurisdiction in which such offer or solicitation is not authorized or to any person to whom it would be unlawful to make such offer or solicitation. Any reference in this document to specific securities and issuers are for illustrative purposes only, and should not be interpreted as recommendations to purchase or sell those securities. References in this document to investment funds that have not been registered with the FINMA cannot be distributed in or from Switzerland except to certain categories of eligible investors. Some of the entities of the NS Partners Group or its clients may hold a position in the financial instruments of any issuer discussed herein, or act as advisor to any such issuer. Additional information is available on request.
© NS Partners Group
Article tagged by: